![]() Because a much greater range of colors is available, finer features of the data can be displayed. One can use a continuous spectrum like the Munsell color wheel, which in theory will reveal features of every size. (However, the eye/mind combination will not be sensitive to the smallest ones.) Or, one can use a spectrum of many discrete colors, which in theory discards information but in practice helps the viewer to see small changes as subtle contour-like steps. The example below was created with a 44-color discrete spectrum created at the University of Kansas.
Because a much greater range of colors is available, finer features of the data can be displayed. One can use a continuous spectrum like the Munsell color wheel, which in theory will reveal features of every size. (However, the eye/mind combination will not be sensitive to the smallest ones.) Or, one can use a spectrum of many discrete colors, which in theory discards information but in practice helps the viewer to see small changes as subtle contour-like steps. The example below was created with a 44-color discrete spectrum created at the University of Kansas.
![]() Shaded-relief can be added to give a 3-D effect and bring out changes in slope. In this method, brightness is increased or decreased in proportion to the East-West component of the gradient of the quantity being displayed. The effect is similar to low-angle sunlight just after dawn or before sunset (when most landscape photographs are taken). Usually, the shaded relief is based on the same dataset as the one which determines the color, as in the topographic map below. However, it is also possible to base the color (hue, saturation) on one data set and the shaded relief (brightness) on another.
Shaded-relief can be added to give a 3-D effect and bring out changes in slope. In this method, brightness is increased or decreased in proportion to the East-West component of the gradient of the quantity being displayed. The effect is similar to low-angle sunlight just after dawn or before sunset (when most landscape photographs are taken). Usually, the shaded relief is based on the same dataset as the one which determines the color, as in the topographic map below. However, it is also possible to base the color (hue, saturation) on one data set and the shaded relief (brightness) on another.
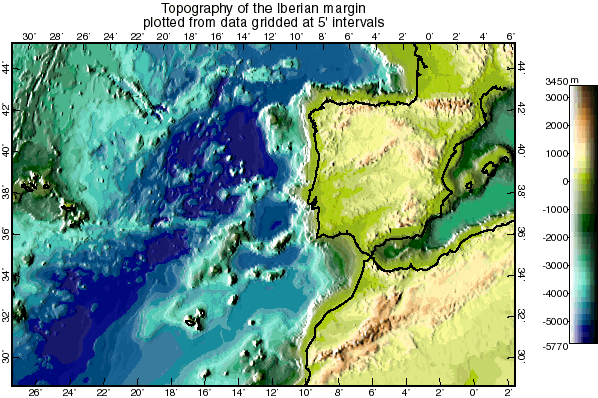
![]() The bitmap-based color method has better computational speed and storage efficiency for datasets with very fine spatial resolution. The example below was based on the ETOPO5 data set with resolution of 5' in latitude and longitude, or 330 ´
192 grid points across the width of the image. (When the same figure was attempted as a high-contrast black & white map or object-oriented color map, the execution times and file sizes became unreasonable; I had to reduce resolution to 15' for those examples, which means that those maps had less information by a factor of 9.)
The bitmap-based color method has better computational speed and storage efficiency for datasets with very fine spatial resolution. The example below was based on the ETOPO5 data set with resolution of 5' in latitude and longitude, or 330 ´
192 grid points across the width of the image. (When the same figure was attempted as a high-contrast black & white map or object-oriented color map, the execution times and file sizes became unreasonable; I had to reduce resolution to 15' for those examples, which means that those maps had less information by a factor of 9.)
