24. P. Bird (1989) New finite element techniques for modeling deformation histories of continents with stratified temperature-dependent rheology, J. Geophys. Res., 94 (B4), 3967-3990.
Abstract. Previous techniques for modeling anelastic deformation of the lithosphere have included plane strain models, restricted to two-dimensional problems, and quasi-three-dimensional "plane stress" or "thin plate" models, that did not accurately include the effects of the shallow frictional layer, or of kinematic detachment of crust from mantle. This paper presents techniques to remedy these deficiencies of thin plate models. An iteration strategy in which the rheology is linearized using artificial prestress and a particular effective viscosity tensor causes the calculation of horizontal velocities to converge monotonically, even with a frictional layer at the top of the lithosphere. A technique using two planar grids allows deformation and displacement to be different at the crust and mantle levels, at far less cost than that of a three-dimensional grid. A finite element technique is developed for computing the changes in thickness of these layers caused by pure shear, simple shear, and pressure gradients. A technique based on relaxation of perturbation eigenfunctions solves the heat equation in the lithosphere during deformation. Accuracy of component numerical methods is good for simple test problems, but in realistic nonlinear problems utilizing all components, only the precision can be determined because of the lack of analytic solutions. Precision of the combined program is tested with a realistic sample problem and presented as a function of the number of iterations in each velocity solution (convergence factor 0.73 to 0.88), size of time step in the predictor/corrector time integration (convergence as D t0.8), and number of degrees of freedom in the finite element grid (convergence as N-0.5 to -0.8 for most variables). Overall cost of a simulation varies with the fractional precision P as P -3.3. A new consequence of kinematic detachment, a moving wave of crustal thickness, is found; unfortunately, the form of the wave depends on the finite element size. This means that element size must be chosen to approximate the smoothing by flexural rigidity effects that were neglected because of cost.
P.S.
In later work, I have found a better linearization of the rheology to replace the formulas of Table 2. (The old formulas give correct results but convergence may be slow.) The new linearization is reflected in the codes for programs FAULTS, PLATES, and SHELLS now offered at this site. P. Bird 2000.09.19
Ý
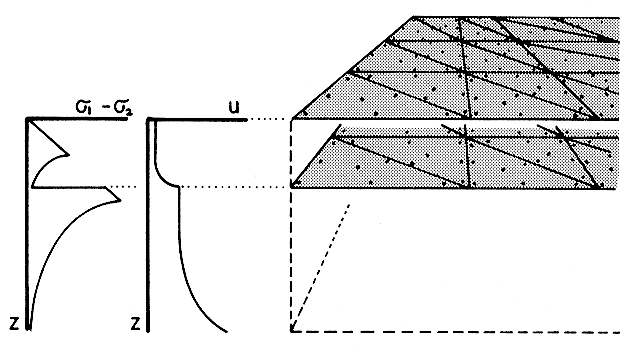
Figure 1. Schematic profiles of the vertical distributions of strength and horizontal velocity in continental lithosphere, and the model proposed to represent them. Strength (left) is defined as the difference between principal stresses at ambient temperature and pressure and a uniform geologic strain rate. Horizontal velocity (center) represents a case with simple shear of both layers and kinematic detachment of crust from mantle. The double-grid scheme proposed in this paper is suggested at right; each grid represents the strong top surface of a layer and its distribution of horizontal velocities. Vertical integration of the strength of each layer and of the simple shear and relative transport within them is accomplished by integration of analytic approximations at many integration points (dots) distributed throughout the grid area.
Ý
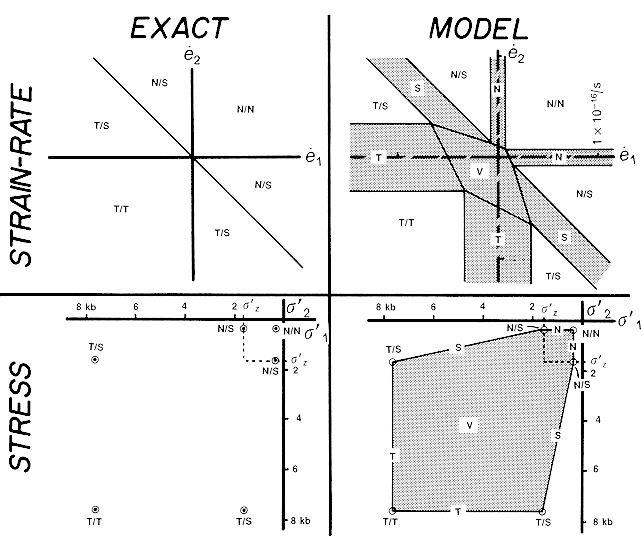
Figure 2. Diagrams of the idealized frictional rheology (left) and model rheology (right) at a depth of 10 km in the frictional layer of the lithosphere. Coordinates s '1 and s '2 are the values of the horizontal effective principal stresses;
Ý
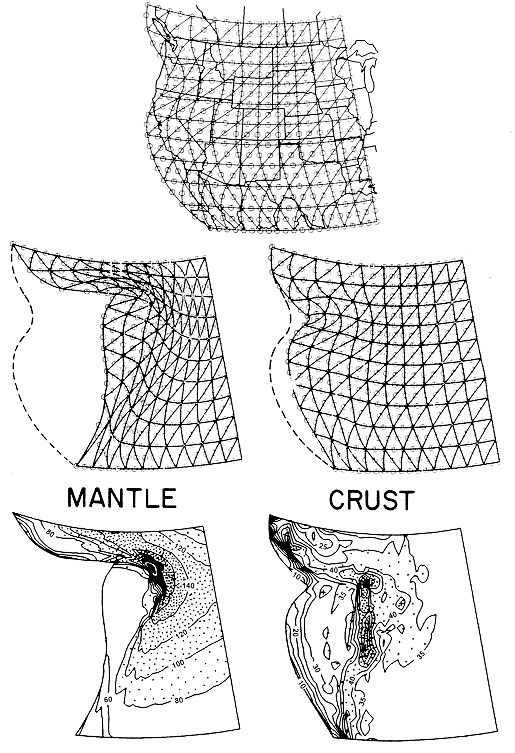
Figure 6. Overview of the actual historical problem used for precision testing. (Top) The region of North America that was modeled and initial shape of the crust and mantle finite element grids used. (Middle) Deformed grids at the mantle and crustal levels after 16 m.y. of strain. (Bottom) Contour maps of the final thickness of each layer; initially, these were uniform, at 70 km for the mantle and 33 km for the crust. Mantle thickness varies from 20 km (western corners) to 200 km (center) with a 20-km contour interval. Crustal thickness varies from 10 km (western margin) to 60 km (center) with a 5-km contour interval.