53. Bird, P., Z. Ben-Avraham, G. Schubert, M. Andreoli, & G. Viola (2006) Patterns of stress and strain rate in southern Africa, J. Geophys. Res., 111(B8), B08402, 14 pages, doi:10.1029/2005JB003882.
The southward propagation of the East Africa rift presents an opportunity to study plate boundary formation. We tabulate orientation data which confirm the province of NW-SE directed most-compressive horizontal principal stress (“Wegener stress anomaly”) earlier tentatively attributed to ridge push. We also collect information on stress “regime,” described by the associated Andersonian fault type(s). We use thin-shell finite-element models with realistic rheology to test three causes of stress: (1) lateral variations in density moment, (2) resistance of unbroken lithosphere to relative plate rotation, and (3) stress concentration ahead of a crack tip. Models with stress due primarily to variations in density moment are unsuccessful in their predictions (59–73% incorrect regimes; 32–40° azimuth errors). Models in which Africa-Somalia spreading is regulated at realistic rates by remote boundary conditions are more accurate (18–41% incorrect regimes; 25–35° azimuth errors). Treating the East Africa rift as a frictionless crack degrades the fit in either case. Apparently, the Wegener stress anomaly is caused primarily by resistance to the relative rotation between the Somalia and Africa plates. The East Africa rift north of 21°S may be weakened by strain but has residual friction ~0.1. Greater strength of oceanic lithosphere is likely to cause stress increases, reorientations, and regime changes offshore. The predicted strain rate map has high rates along the rift, curving at 12°S into a western arc through Angola-Namibia-South Africa. Seismic hazard in Namibia may be greater than the instrumental catalog suggests. However, a number of unfit data indicate that these models represent only a first step.
Entire paper (14 pages) as .pdf file
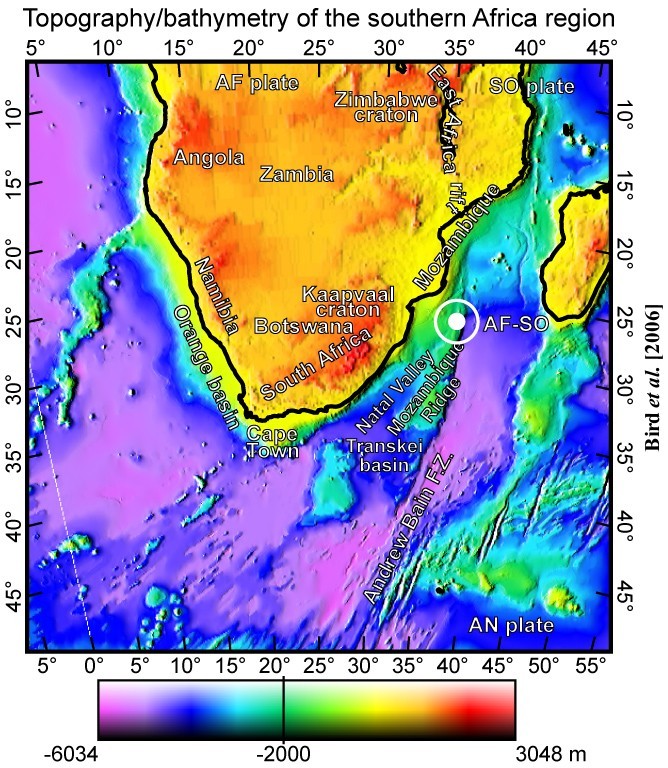
Figure 1. Topography and bathymetry of the southern Africa region, identifying places mentioned in the text. Plate abbreviations: AF Africa, SO Somalia, AN Antarctica. Circled dot AF-SO is the estimated Euler pole of Chu & Gordon [1999]; for other estimates, see Fernandes et al. [2004] and Horner-Johnson et al. [2005]. ETOPO5 topography of [anonymous, 1988].
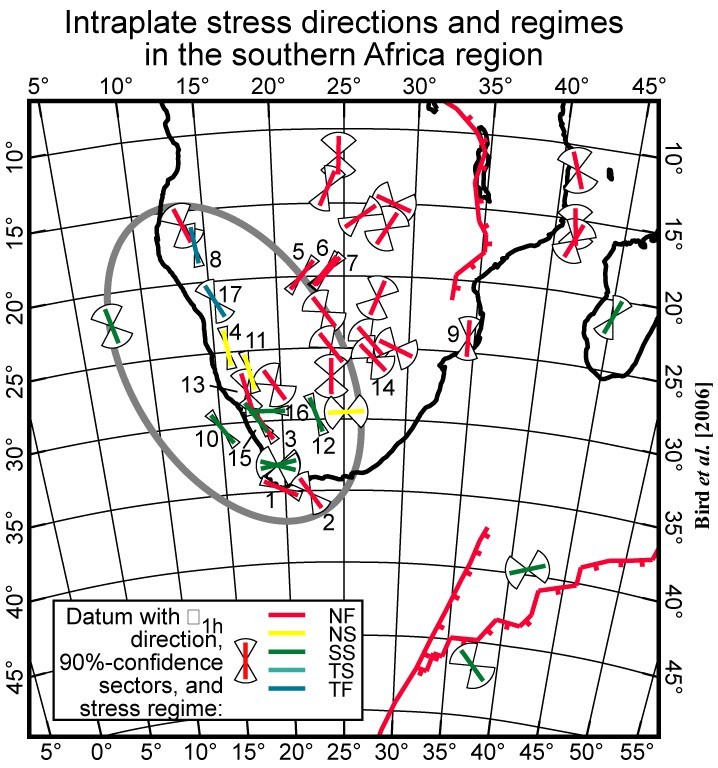
Figure 2. Intraplate
indicators of stress regime (indicated by color) and azimuth of the
most-compressive horizontal principal stress (![]() ). Both data
from the World Stress Map and data from Table 1 are shown; the latter have
index numbers keyed to the table. We exclude all plate-boundary data,
using a more rigorous test than the WSM. The approximate region of the
“Wegener stress anomaly” (Wegener stress-direction province) is suggested by
the ellipse.
). Both data
from the World Stress Map and data from Table 1 are shown; the latter have
index numbers keyed to the table. We exclude all plate-boundary data,
using a more rigorous test than the WSM. The approximate region of the
“Wegener stress anomaly” (Wegener stress-direction province) is suggested by
the ellipse.
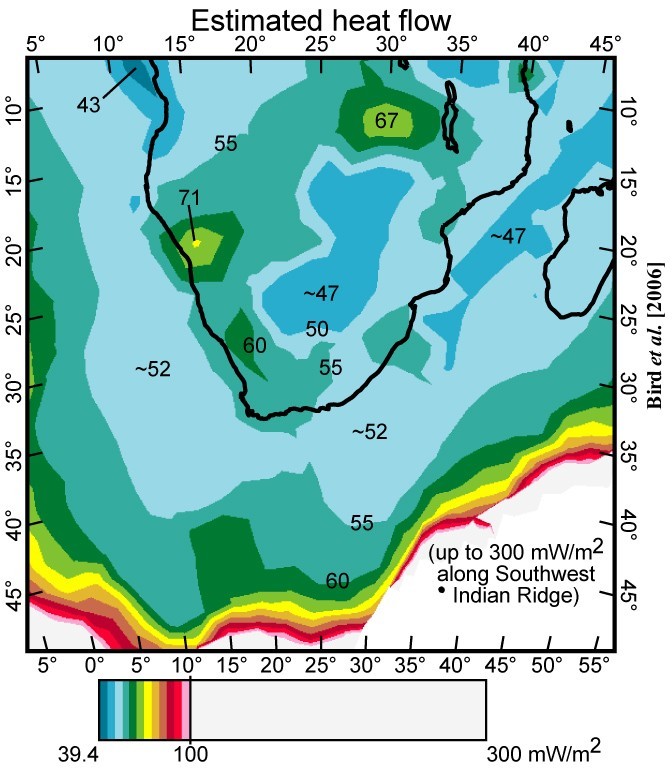
Figure 3. Map of estimated heat flow. Contour interval 5 mW/m2. Values up to 300 mW/m2 along the Southwest Indian Ridge spreading center are allowed to go off-scale, so as to display small variations within southern Africa and its continental margins.
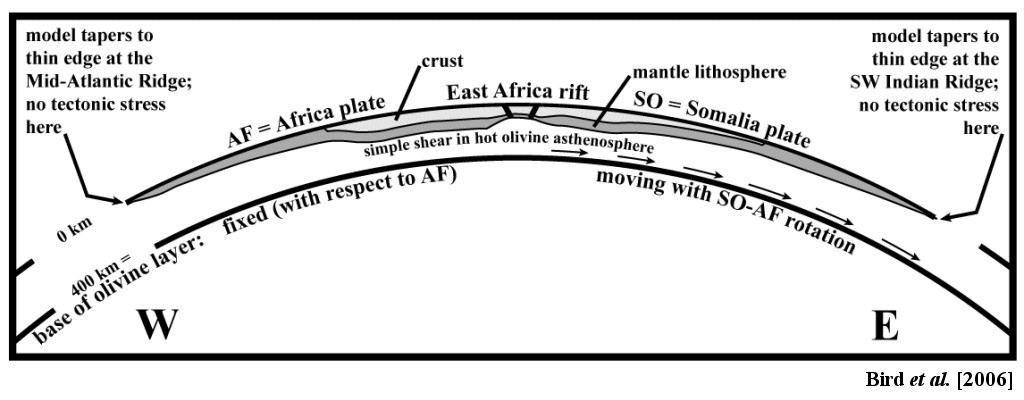
Figure 4. Schematic cross-section of the model along an East-West great circle, showing how the velocity field on the surface is linked to an assumed velocity field at a depth of 400 km, through the rheology of a hot olivine asthenosphere. In the early models this deep velocity field was assumed to be uniformly static with respect to northwest AF. In later models a divergent flow (shown here) was assumed, to drive (or permit) relative rotation of SO with respect to AF. Thicknesses of crust and mantle lithosphere are generic and not to scale.
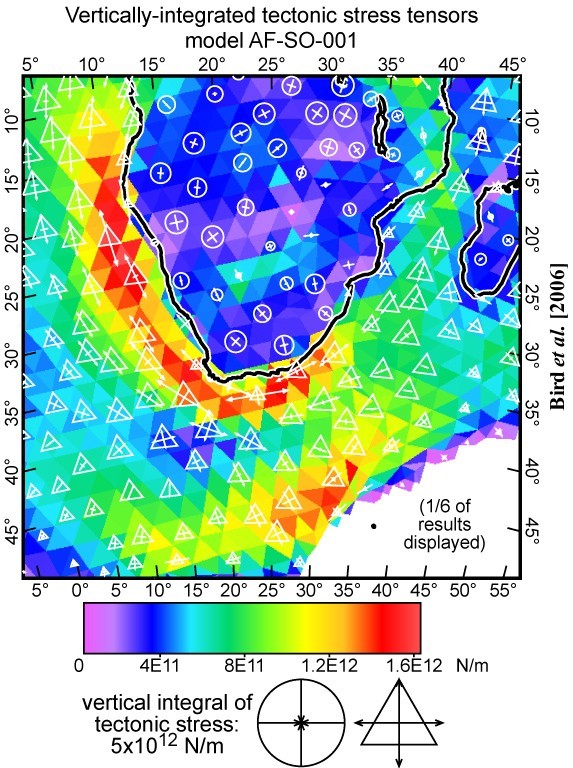
Figure 5. Vertical integrals, through the model lithosphere, of the tectonic stress tensor (symbols) and of the greatest shear stress (colors), for model AF-SO-001. This particular model stress field is almost entirely due to lateral variations in density moment. The “tectonic stress tensor” is defined as the total stress tensor minus the lithostatic pressure expected at the same elevation beneath a mid-ocean spreading ridge with no strength. Circles show negative vertical components of the vertical integrals of tectonic stress (on land and in shallow water), and triangles show positive vertical components of the vertical integral of tectonic stress (in ocean basins deeper than the reference spreading ridge). Tensor symbols for vertical integrals of tectonic stress are scaled by radius (not area), and the reference symbols in the margin portray isotropic compression and tension, respectively.

Figure 6. Vertical integrals, through the model lithosphere, of the tectonic stress tensor (symbols) and of the greatest shear stress (colors), for the preferred model AF-SO-013. Conventions as in Figure 5. This model stress field also includes effects of lateral variations in density moment, but is dominated by relative rotation of SO with respect to AF, which is set to realistic rates using basal tractions and one distant velocity boundary condition.
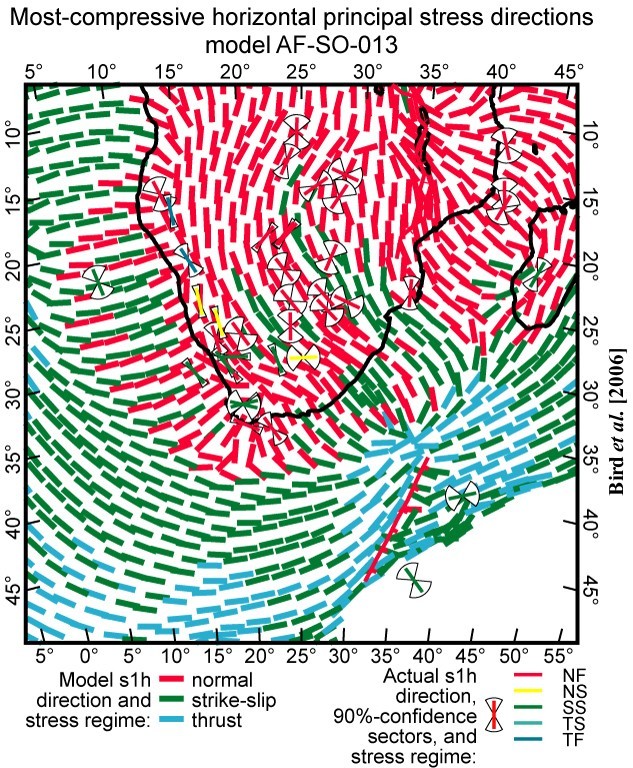
Figure 7. Most-compressive horizontal principal stress directions from the preferred model, AF-SO-013, which is dominated by effects of relative plate rotation. Stress regimes (colors) explained in text. Available data (with uncertainty fans) are from Figure 2.

Figure 8. Vertical integrals, through the model lithosphere, of the tectonic stress tensor (symbols) and of the greatest shear stress (colors), for model AF-SO-015. Conventions as in Figure 5. This model shows only the effects of relative rotation of SO with respect to AF, because it includes no lateral variations in either lithosphere strength or density moment, except for the low-friction faults indicated along the East Africa rift and Andrew Bain fracture zone.
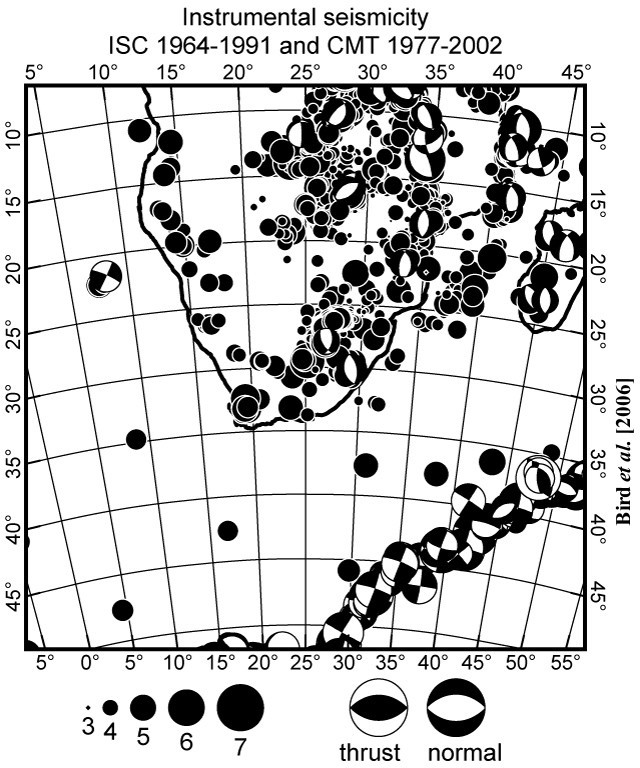
Figure 9. Instrumental seismicity of the southern Africa region, as recorded in two teleseismic catalogs: International Seismological Center 1964-1991 (solid dots with no focal mechanism) and Harvard Centroid Moment Tensor catalog 1977-2002 (“beach-balls” showing focal mechanisms on lower focal hemispheres). Note the much higher seismicity on land than at sea, which is better predicted by model AF-SO-013 (with lateral heterogeneities) than by model AF-SO-015 (without lateral heterogeneities).
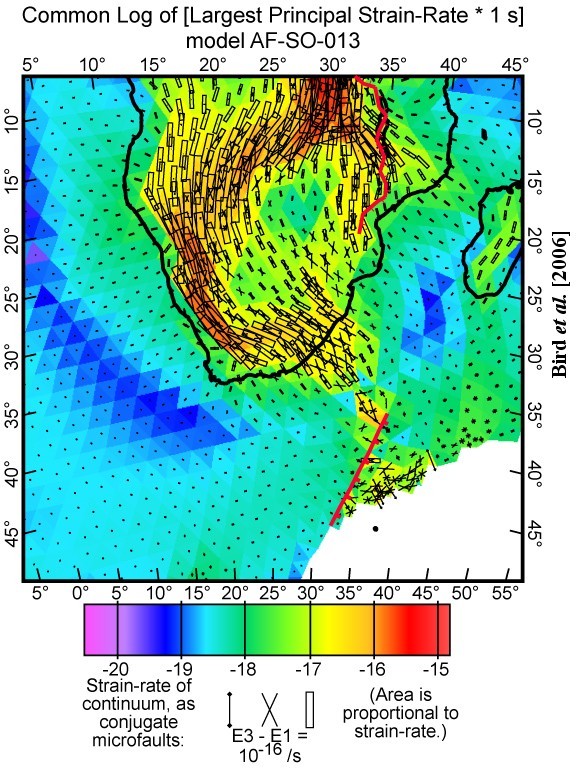
Figure 10. Long-term-average (anelastic) strain rates predicted by the preferred model, AF-SO-013. Color indicates the common logarithm of the magnitude of the principal strain rate with greatest absolute value (in units of s-1). Symbols show orientation of the strain rate tensor in terms of the strikes of conjugate microfaults predicted. Rectangles represent grabens (horizontal extension); dumbells with diamond-shaped terminations represent thrust faults (horizontal shortening), and X symbols indicate conjugate strike-slip faults (one sinistral and one dextral in each pair). There is a close relationship between this figure and the map of estimated heat flow (Figure 3).