56. Liu, Z., & P. Bird [2008] Kinematic modelling of neotectonics in the Persia-Tibet-Burma orogen, Geophys. J. Int., 172(2), 779–797; doi: 10.1111/j.1365-246X.2007.03640.x, + 3 digital file appendices.
We apply a new kinematic modelling technique (program NeoKinema) to estimate neotectonic flow in the Persia–Tibet–Burma orogen. The models fit geodetic benchmark velocities, geological fault slip rates and stress directions (seismic moment tensor orientations) using a weighted least-squares method. Models predict long-term velocities, anelastic strain rates, and preferred fault slip rates averaged over timescales of 104–106 yr. While we find a few regions of low anelastic strain rate, the mean continuum strain rate in the preferred model is 2.2 × 10⁻¹⁶ s−1 (0.7 %/Ma), so the India-Eurasia collision should not be modelled as an interaction between rigid microplates. For most faults, preferred fault slip rates agree with geological slip rates within their uncertainty bounds; this suggests that deformation imaged by geodesy over tens of years is consistent with deformation over 104–106 yr (given appropriate elastic corrections).We also calculate maps of long-term-average seismicity rate based on model fault slip rates and anelastic strain rates in the continuum, using the seismicity parameters of most comparable type of plate boundary. The pattern is generally in agreement with actual m > 5.67 earthquakes in the CMT catalogue (1977–2002), except that the Himalayan front, High Zagros, and Altyn Tagh zones have been quieter than predicted. The spatial integral of our forecast over the orogen is 371 m > 5.67 earthquakes/25.75 yr, versus 238 which actually occurred. If this discrepancy has high significance, it means that some step(s) in our forecast method are faulty (such as the assumption of equal coupled seismogenic thickness in all continental convergent boundaries). If it is only an artifact of stochastic time-dependence, then this may have occurred in the orogen, in the external calibration region, or in both. Independent evidence suggests that large earthquakes (with many aftershocks) will occur along the Himalayan front in the future, possibly reducing this discrepancy.
P.S. The mw 7.9 earthquake of 2008.05.12 in the Longmen Shan adjacent to the northwestern Sichuan basin might focus attention on this part of our model. We had input the Longmen Shan fault system as a 350-km-long straight fault dipping NW, from (30.8°N, 102.1°E) to (33.3°N, 104.3°E), with oblique slip of dextral and thrust sense. Our prior (input) offset rates were 2.5 mm/a for each of the strike-slip and convergent heave components, each with an assumed standard deviation of 1 mm/a. These estimates were from England & Molnar [1997, GJI], where they were supported by geologic and geodetic references. Our posterior (output) heave rate components in our preferred model were 2.2 mm/a of convergent heave and 1.9 mm/a dextral, for a net heave rate of 2.9 mm/a. Using the coseismic dip estimate of 33°NW from the Global CMT quick solution, our posterior (output) estimate of the net slip rate becomes 3.3 mm/a. Since the Finite Fault Model posted by Chen Ji (UCSB) and Gavin Hayes (NEIC) estimates slips of 5 m over most of the rupture, with up to 9 m at each of two asperities, the nominal recurrence times would be 2700 years at these asperities, or 1500 years over most other parts of the recent rupture. Perhaps these estimates could be compared to the historical and archeological record provided by the Qiang castles, such as those remaining at Taoping. P. Bird, 2008.05.12
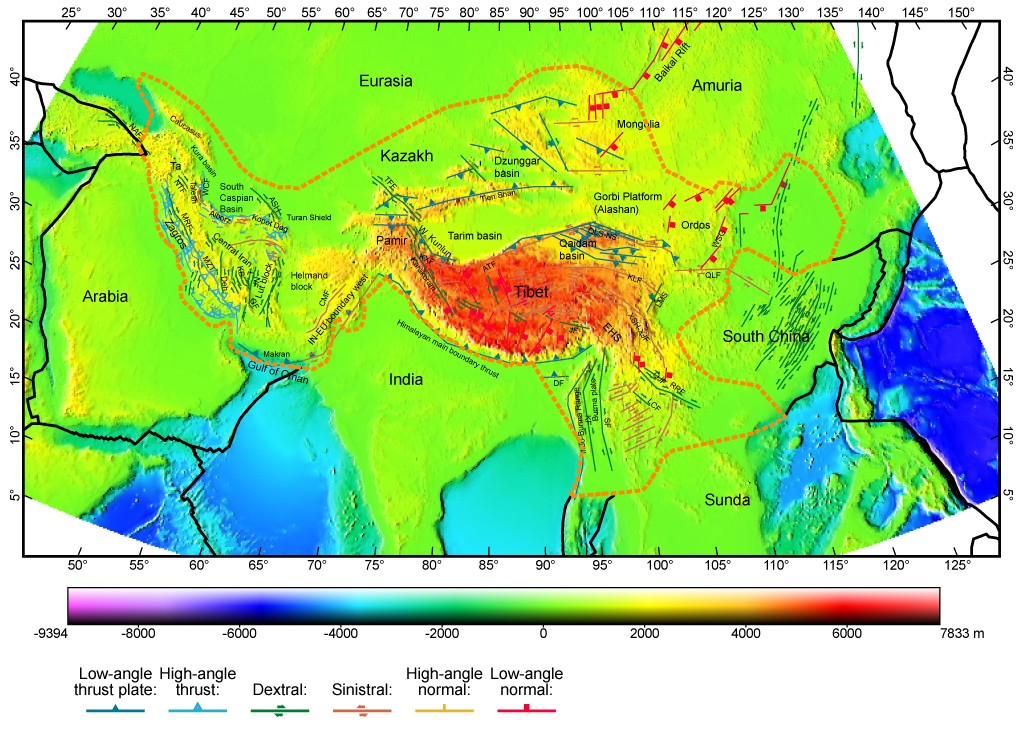
Figure 1. Surface topography and major faults in and around the Persia–Tibet–Burma orogen (heavy dashed curve). Oblique Mercator projection on great circle passing E–W through (84◦E, 35◦N). Topography data from ETOPO5. Fault traces are from Holt et al. (2000) and Berberian & Yeats (2001). Active faults are represented by thin lines. Symbols on the fault traces and colours represent fault type: open triangle and light blue trace = high-angle thrust fault; solid triangle and dark blue trace = low-angle thrust fault; green = dextral fault; brown = sinistral fault; thin line and yellow trace = low-angle normal fault; solid square and red trace = high-angle normal fault. Rigid plates adjacent to orogen are named following global plate model PB2002 (Bird 2003). Abbreviations of fault and geographic names: ASH = Ashkabad fault; ATF = Altyn Tagh fault; CMF = Chaman fault; Deh = Dehshir fault; DF = Dauki fault; EHS = Eastern Himalayan syntaxis; GF = Gawk fault; JF = Jiali fault; K = Kabaw fault; KB = Kuh Banan fault; KLF = Kunlun fault; KSF = Kongur-Shan fault; KXF = Karakax Fault; L = Lakarkuh fault; LCF = Langcang fault; LMS = Longmen Shan; MRF = Main Recent fault; MZT = Main Zagros thrust; NAF = North Anatolia fault; NF = Nayband fault; NTF = North Tabriz fault; QJF = Qujiang fault; QLF = Qinling fault; QLS-NS = Qilian Shan-Nan Shan; RRF = Red River fault; Ta = Tabriz; TFF = Talas-Fergana fault; WCF = West Caspian fault; WKT = Western Kunlun thrust; WSG = Weihe Shanxi graben system and XSH-XJF = Xianshuihe-Xiaojiang fault.
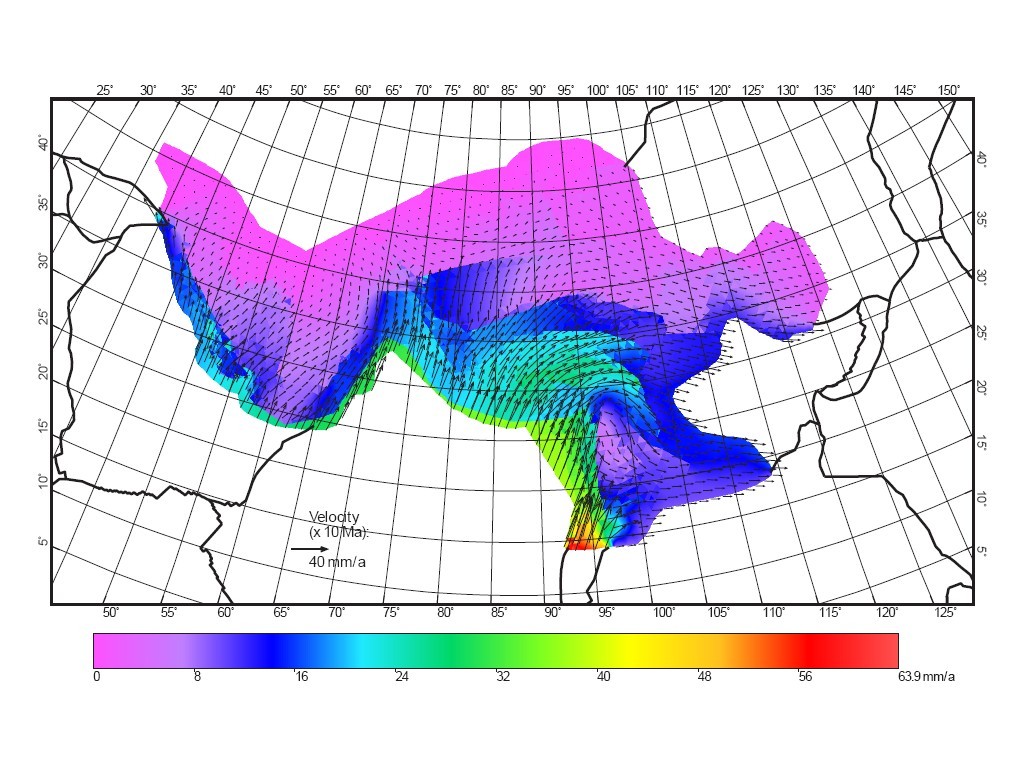
Figure 8. Long-term-average velocity field of preferred model PTB2007008. Colour map represents velocity magnitude (relative to stable Eurasia). Velocity vectors are indicated by thin arrows. Thick lines represent major plate boundaries in PB2002.
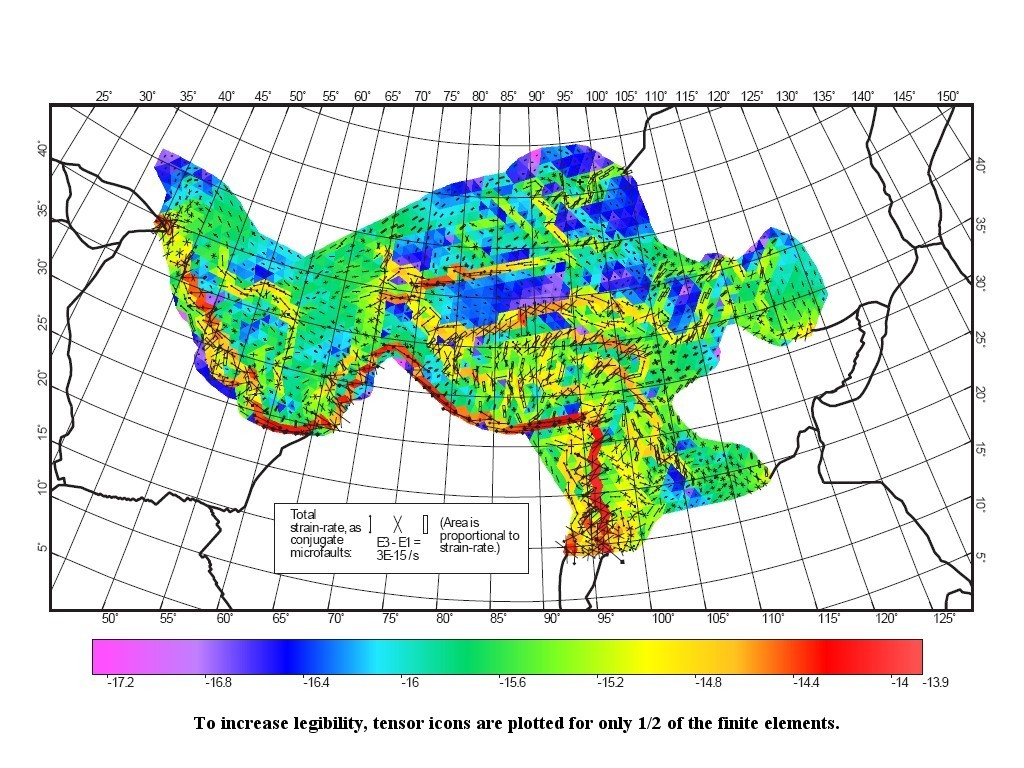
Figure 9. Total long-term-average anelastic strain-rate field (including faulting) of preferred model PTB2007008. Coloured background shows common logarithm of the magnitude of the principal strain rate which has the greatest magnitude. Overlying icons show total strain rate tensor (expressed as microfault orientations): dumbbell symbols show conjugate thrust faulting; X symbols show conjugate strike-slip faulting; rectangles show conjugate normal faulting. The fault symbols are sized with area proportional to strain-rate. To increase legibility, tensor icons are plotted for only 1/2 of the finite elements.

Figure 10. Posterior (output) best-estimate fault heave rates from model PTB2007008. The width of each ribbon plotted along a fault trace is proportional to long-term heave rate, which is also given by numbers in mm/a.
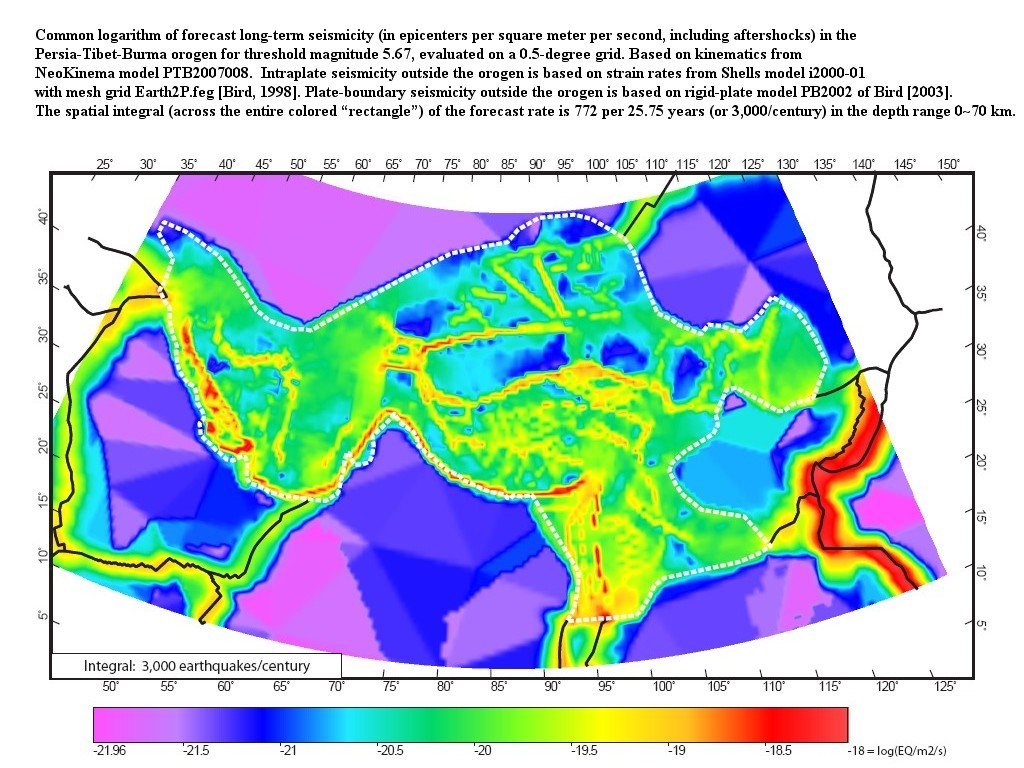
Figure 13. Common logarithm of forecast long-term seismicity (in epicentres per square metre per second, including aftershocks) in the Persia–Tibet–Burma orogen for threshold magnitude 5.67, evaluated on a 0.5-degree grid. Based on kinematics from NeoKinema model PTB2007008. Intraplate seismicity outside the orogen is based on strain rates from Shells model i2000-01 with mesh grid Earth2P.feg (Bird, 1998). Plate-boundary seismicity outside the orogen is based on rigid-plate model PB2002 of Bird (2003). The spatial integral (across the entire coloured ‘rectangle’) of the forecast rate is 772 per 25.75 yr (or 3000 per century) in the depth range 0–70 km. The spatial integral in the orogen (indicated by the heavy dashed line) of the forecast rate is 371 per 25.75 yr (or 1441 per century) in the depth range 0–70 km.
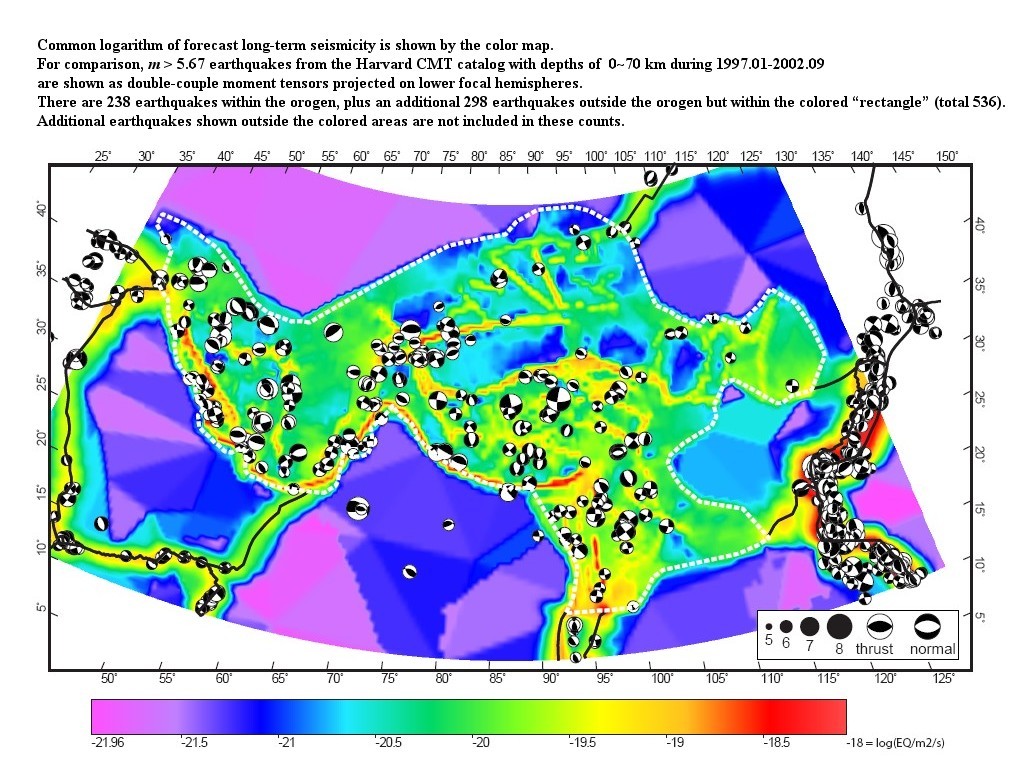
Figure 14. Common logarithm of forecast long-term seismicity is shown by the colour map. (See Fig. 13 for details.) For comparison, m > 5.67 earthquakes from the Harvard CMT catalogue with depths of 0–70 km during 1997.01–2002.09 are shown as double-couple moment tensors projected on lower focal hemispheres. There are 238 earthquakes within the orogen, plus an additional 298 earthquakes outside the orogen but within the coloured ‘rectangle’ (total 536). Additional earthquakes shown outside the coloured areas are not included in these counts.
NeoKinema model of the Persia-Tibet-Burma orogen
Long_Term_Seismicity forecast for the Persia-Tibet-Burma orogen