57. Bird, P., Z. Liu, & W. K. Rucker (2008) Stresses that drive the plates from below: Definitions, computational path, model optimization, and error analysis, J. Geophys. Res., 113(B11), B11406, 32 pages plus digital appendices, doi:10.1029/2007JB005460.
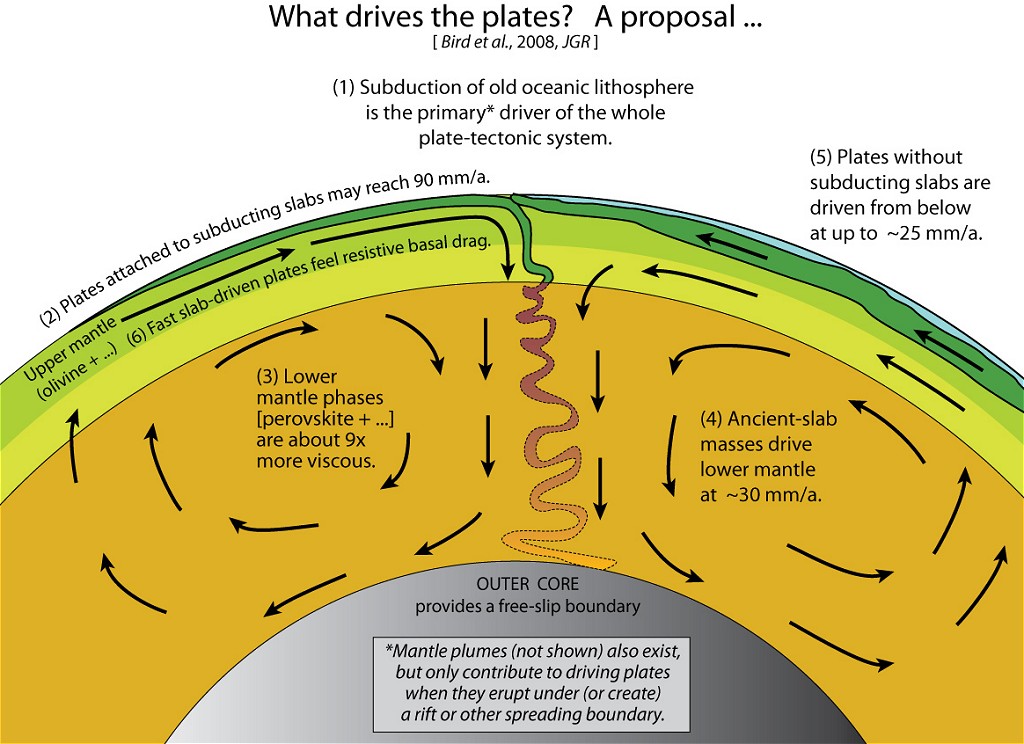
We divide the torques on each surface plate into 3 parts: lithostatic-pressure, side-strength, and basal-strength. We compute each part for each of 52 plates using a thin-shell finite-element model of the lithosphere with: topography, variable heat-flow, variable crust and lithosphere thicknesses from seismic data, transient geotherms, nonlinear rheology, and weak faults. We present an iterative method of adjusting boundary conditions that results in correct plate velocities without the need for models of deep mantle flow. Uncertainty remains because side-strength torques, and therefore inferred basal-strength torques, depend on the effective friction of faults. Therefore, we compute a two-parameter suite of models with differing trench resistance and differing fault friction, and evaluate their misfits relative to: seafloor spreading rates, geodetic velocities, intraplate stress directions, and azimuths of seismic anisotropy. The minimum misfit occurs at effective fault friction of 0.1 and trench resistance 2´1012 N/m. In this preferred model, computed values of mean basal-strength traction systematically increase for smaller plates. We analyze error sources and find that the largest source is unmodeled variation in effective friction of plate-boundary faults. Discounting highly uncertain results, we find mean basal shear tractions of no more than 1 MPa for the 6 largest slabless plates: AF 0.2 MPa; AN 0.1 MPa; NA 0.6 MPa; EU 1.0 MPa; SA 1.0 MPa; SO 0.9 MPa. The directions of basal shear traction on these plates are generally forward, meaning subparallel to absolute velocity. Basal-strength torques on plates with subducting slabs represent the sum of net slab-pull and distributed basal shear traction; if these torques are attributed to net slab-pull alone, net slab-pull is generally toward the trench and of order 5´1012 N/m. Thus, present plate motions on Earth appear to be driven primarily by deep mantle convection, rather than by topography and associated lithostatic pressures.
P.S. For important updates and improvements to this model, see Bird et al. [2026].
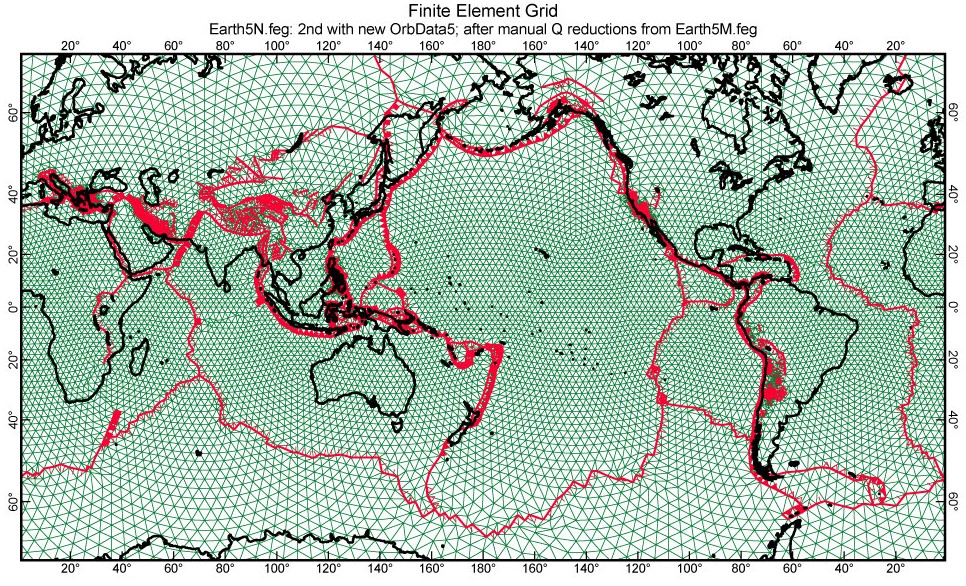
Figure 1. Mercator projection of most of the Earth5 thin-shell spherical finite-element grid used in this study. Green lines are continuum element boundaries; largest elements have 240-km sides. Red lines with dip marks are fault elements, along plate boundaries and within orogens: no tick = 90° dip; straight tick = 55°; box = 45°; open triangle = 20°; filled triangle = 14° (subduction zone).
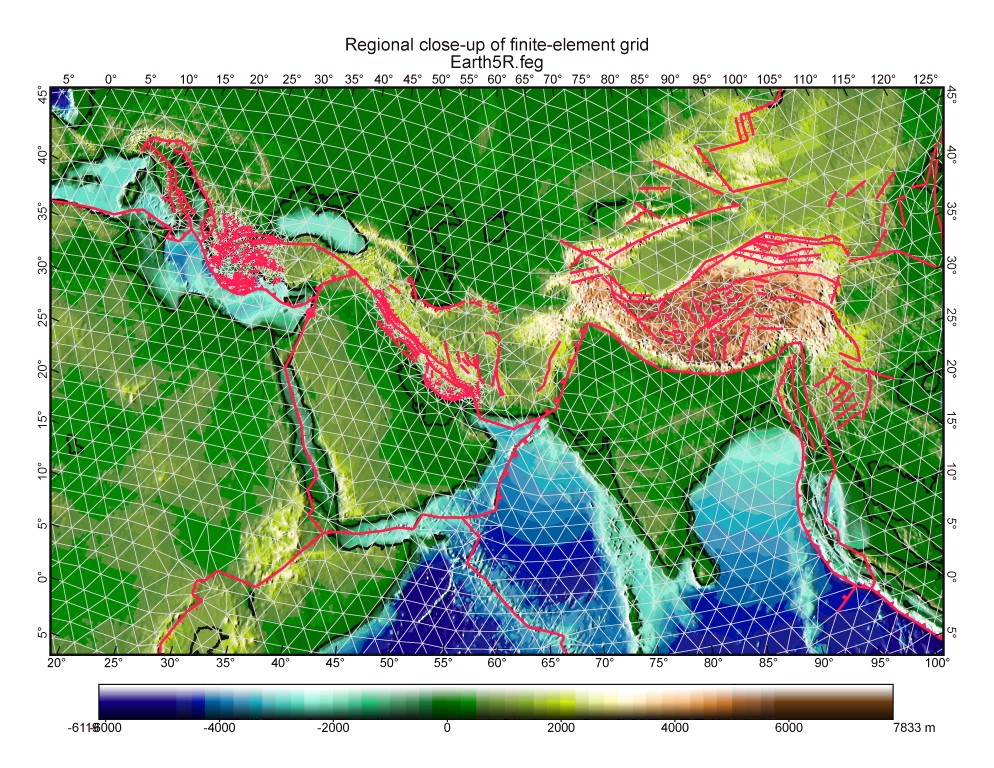
Figure 2. Close-up view of the Aegean-Persian-Tibetan portion of the finite element grid of Figure 1, superimposed on a topographic base map with shaded relief. Fault symbols as in Figure 1.
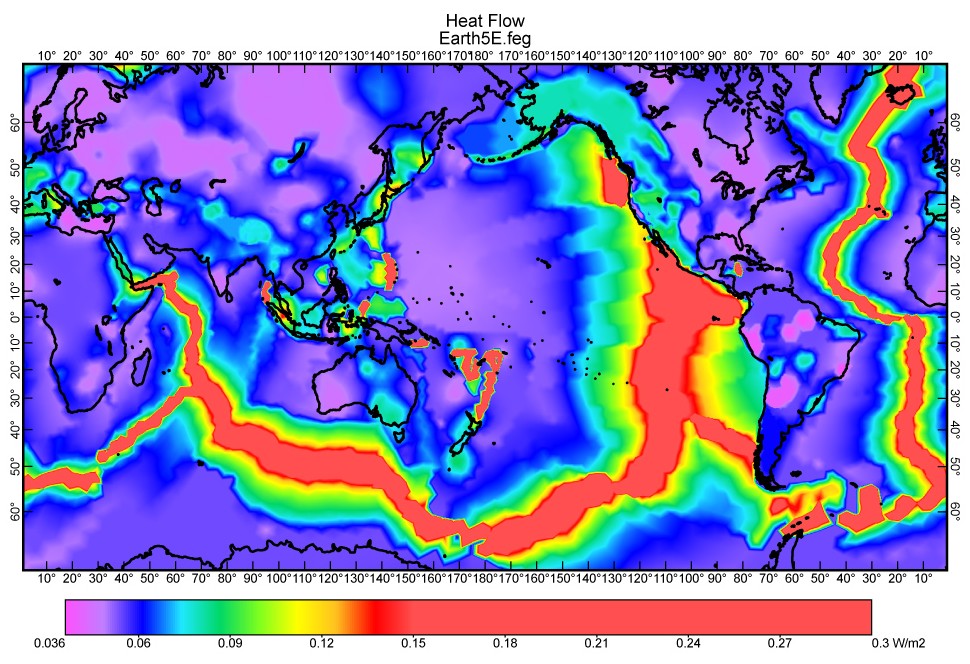
Figure 3. Composite heat-flow model obtained by merging age-dependent model heat-flow from Stein & Stein [1992] (where seafloor age is known from Mueller et al. [1997]) with interpolated heat-flow kriged from data of Pollack et al. [1991, 1993] and/or published maps in some continental areas. Color scale is selected to show detail in continental areas of relatively low heat-flow. All spreading ridges were assigned uniform 0.3 W/m2 conductive heat flow along their centers.
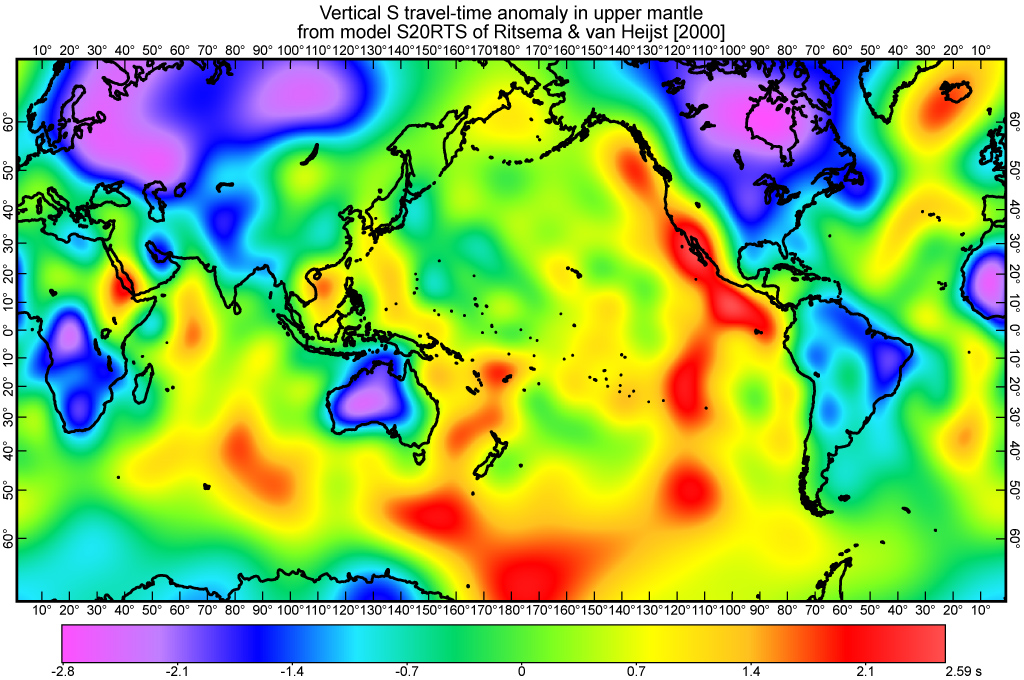
Figure 4. Travel-time anomalies for vertically-incident S waves traveling though the upper mantle above 400 km depth, from the S20RTS model of Ritsema & Van Heijst [2000]. Corrected for variations in crustal structure, to give the upper-mantle anomaly.
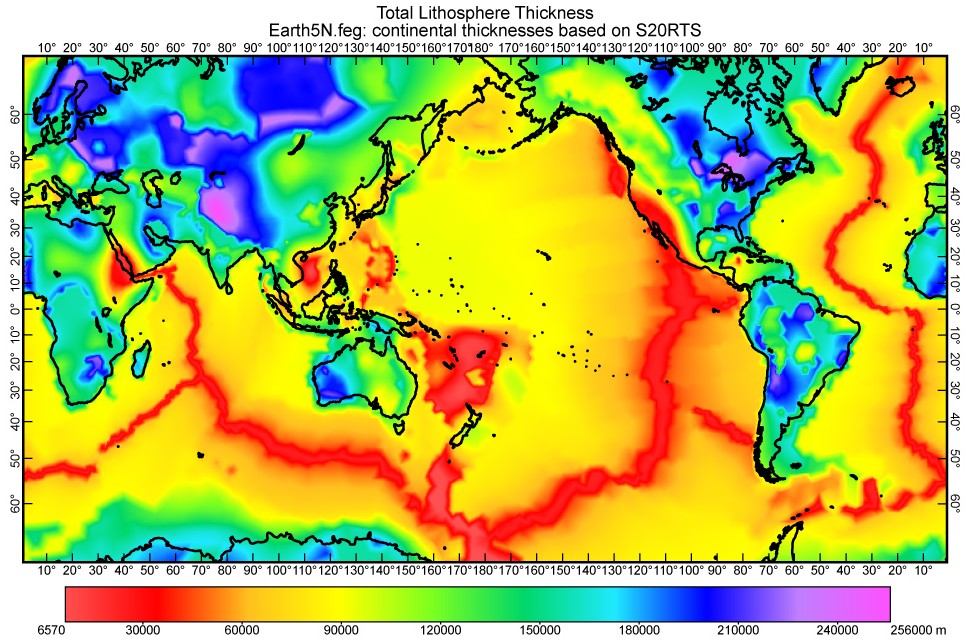
Figure 5. Model of total lithosphere thickness. A composite of continental thicknesses scaled from vertical-S-wave upper-mantle travel-time-anomalies (in Figure 4), and an age-dependent model in the ocean basins. Some extreme values were further adjusted to prevent model geotherms from having maxima higher than the assumed asthenosphere temperature.
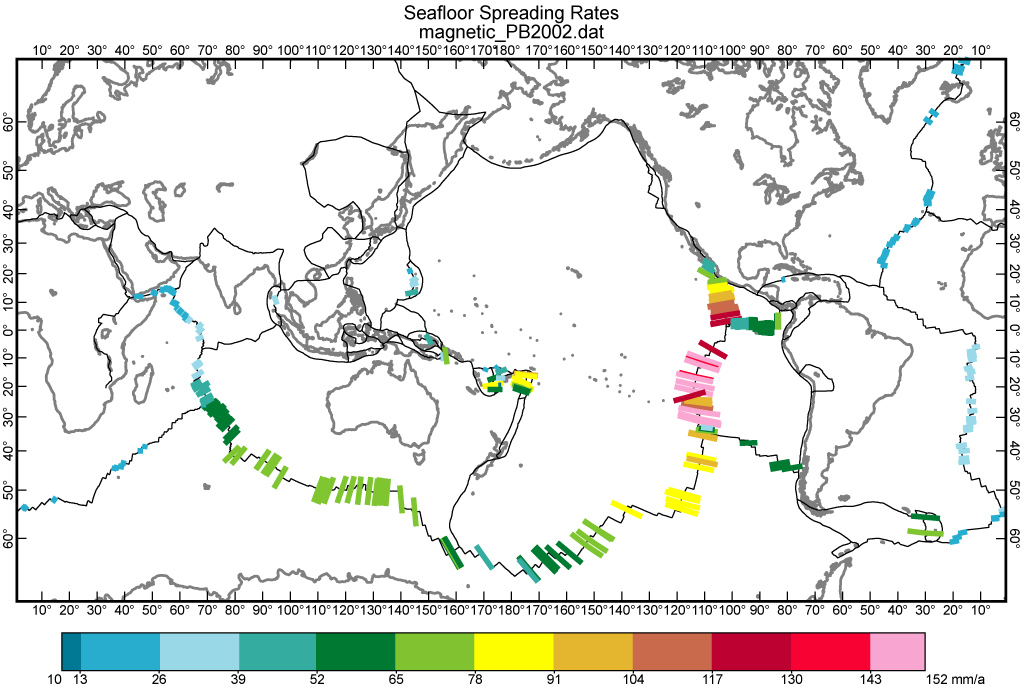
Figure 6. Spreading rates of mid-ocean ridges, based on identification of linear magnetic anomaly bands. Most (277) data from Table 3 of DeMets et al. [1990], corrected downward by 4.4% for the timescale adjustment of DeMets et al. [1994]. Back-arc spreading and microplate tectonics are represented by 35 additional rates whose citations were given by Bird [2003].

Figure 7. Velocities of geodetic benchmarks (GPS technique) from the dataset of Kreemer et al. [2003], who excluded known coseismic and post-seismic anomalies. We further filtered the dataset to remove benchmarks less than 100 km from subduction zone trenches or less than 25 km from other plate boundaries, because within those bands our approximate correction for effects of temporary fault locking and elastic strain accumulation might be inadequate.
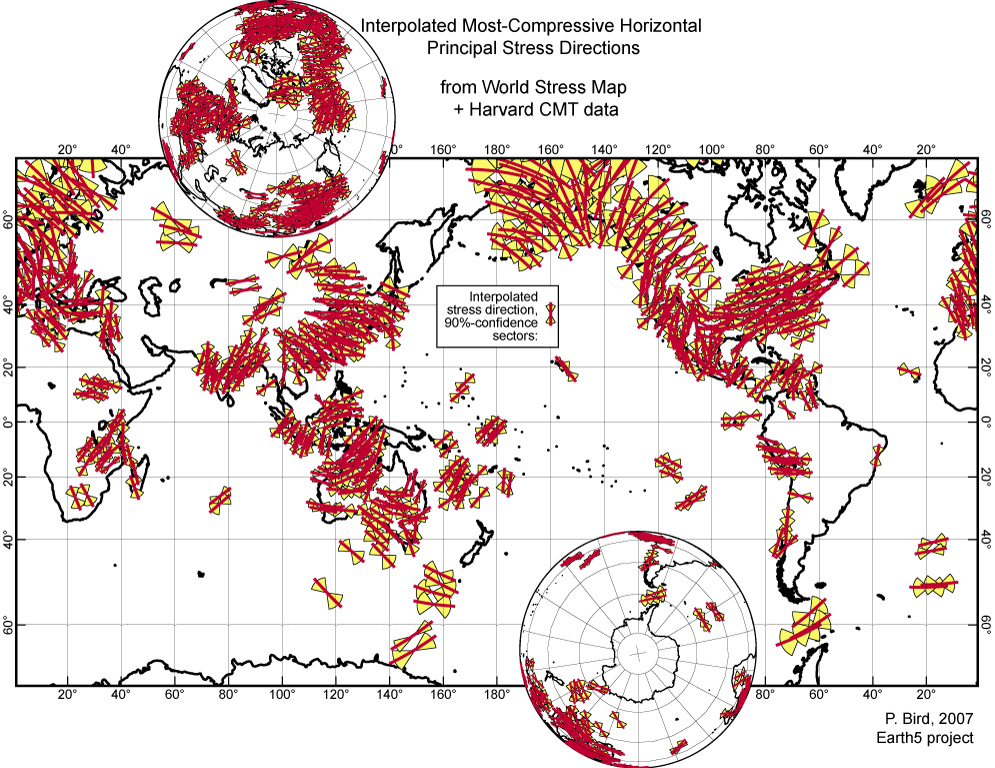
Figure 8.
Most-compressive horizontal principal stress directions (![]() ) with
their respective 90%-confidence sectors. Obtained by interpolation of
non-seismic World Stress Map data, plus intraplate Harvard CMT moment tensor
orientations, to a regular global grid by the clustered-data technique of Bird
& Li [1996]. Results shown only where 90%-confidence sectors were
±45°
or narrower. Main map is Mercator projection; polar insets are
orthographic.
) with
their respective 90%-confidence sectors. Obtained by interpolation of
non-seismic World Stress Map data, plus intraplate Harvard CMT moment tensor
orientations, to a regular global grid by the clustered-data technique of Bird
& Li [1996]. Results shown only where 90%-confidence sectors were
±45°
or narrower. Main map is Mercator projection; polar insets are
orthographic.
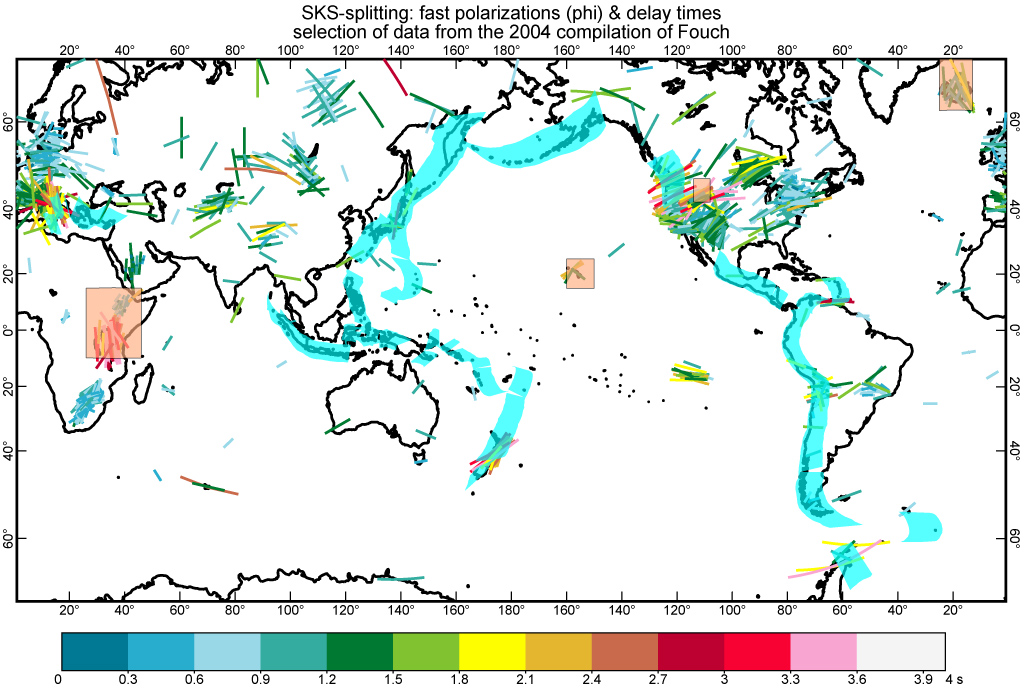
Figure 9. Azimuths of
fast polarization of SKS waves (![]() ) arriving at seismic
stations, from the global compilation of Fouch & Rondenay
[2006]. Size and color of symbol are determined by the splitting time in
s. Blue bands extend 700 km inland from subduction zones, indicating that
we did not use data from these regions. Four additional rectangular
regions around the East Africa rift, Hawaii, Yellowstone, and Iceland hotspots
were also edited out.
) arriving at seismic
stations, from the global compilation of Fouch & Rondenay
[2006]. Size and color of symbol are determined by the splitting time in
s. Blue bands extend 700 km inland from subduction zones, indicating that
we did not use data from these regions. Four additional rectangular
regions around the East Africa rift, Hawaii, Yellowstone, and Iceland hotspots
were also edited out.
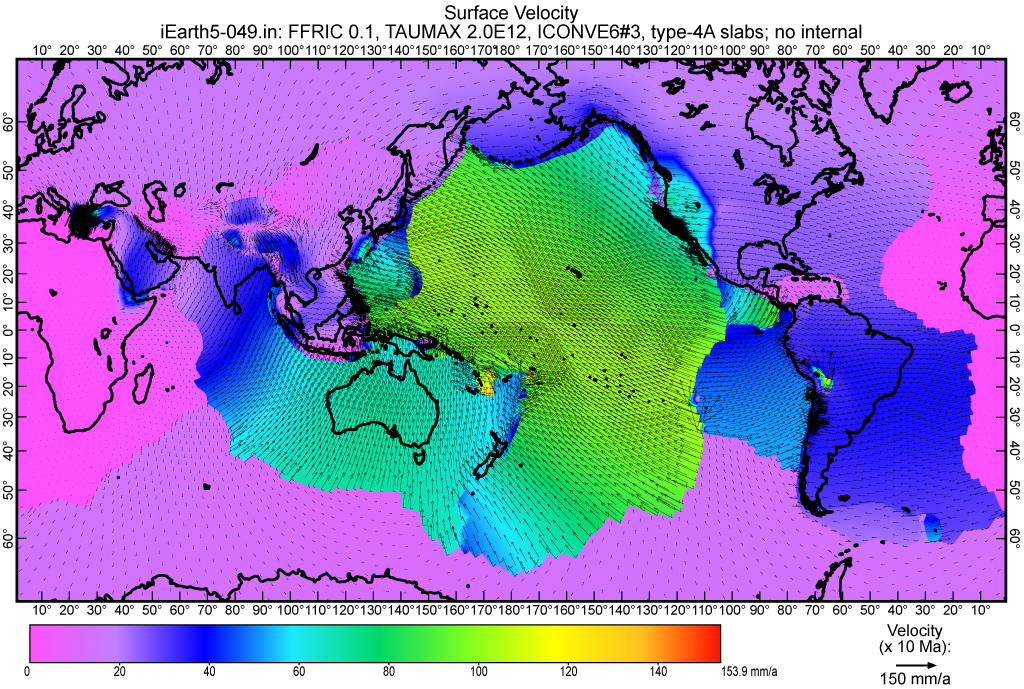
Figure 10. Surface velocity field from the preferred finite-element model Earth5-049. Most plates have correct velocity (according to PB2002 model of Bird [2003]) because they were forced by boundary conditions, as explained in text. Three regions of unphysical behavior may be seen around Tibet, in western North America, and in the central Andes.

Figure 11. Fault heave rates from the preferred finite-element model Earth5-049. Equivalent to the velocity discontinuities in Figure 10. See caption of Figure 10 for comments on realism.

Figure 12. Intraplate long-term (anelastic) strain-rate from the preferred finite-element model Earth5-049. Excludes all straining due to slip rates of fault elements. Equivalent to those velocity gradients in Figure 10 which are not due to Eulerian plate rotation on a sphere. See caption of Figure 10 for comments on realism.
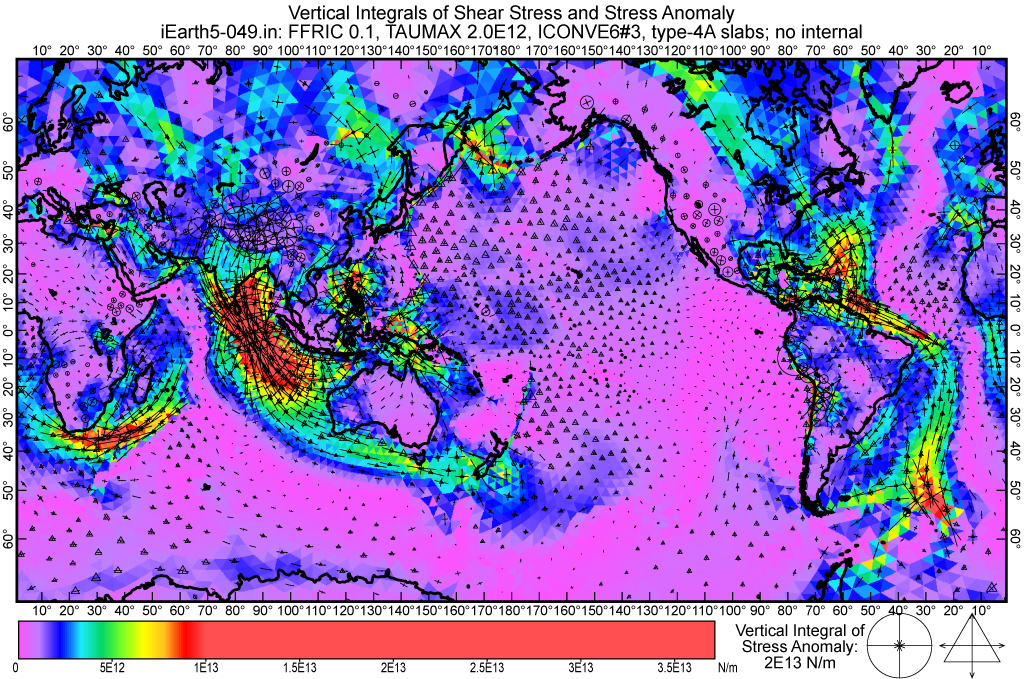
Figure 13. Vertical integrals of stress anomaly (small tensor symbols), and vertical integrals of maximum shear stress (colors) in the preferred finite-element model Earth5-049. Color scale is designed to emphasize variations within the low-intensity parts of the stress anomaly field. It is notable that the strongest predicted stress fields do not cross plate boundary faults, but occur within oceanic lithosphere where distinct plates are converging (IN-AU, SA-SC) or diverging (AF-SO, NA-SA) in the PB2002 model of Bird [2003]. The realism of these very strong intraoceanic stress fields is uncertain.
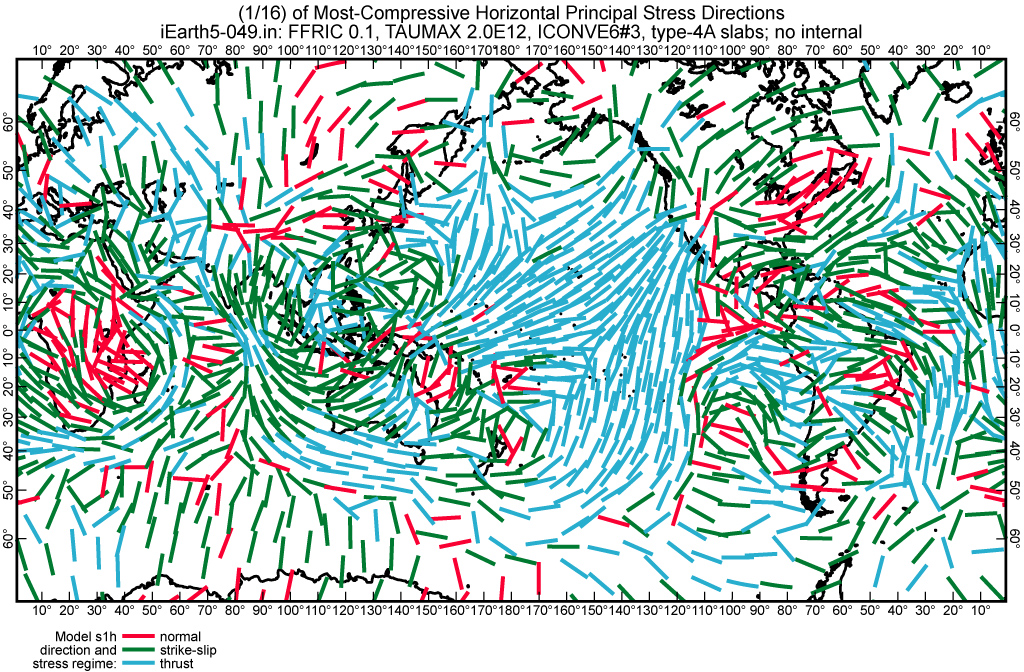
Figure 14.
Most-compressive horizontal principal stress directions (![]() ) from
the preferred finite-element model Earth5-049. Bars are color-coded
according to predicted stress regime: red = normal-faulting; green =
strike-slip; blue = thrust-faulting. Compare to Figure 8.
) from
the preferred finite-element model Earth5-049. Bars are color-coded
according to predicted stress regime: red = normal-faulting; green =
strike-slip; blue = thrust-faulting. Compare to Figure 8.
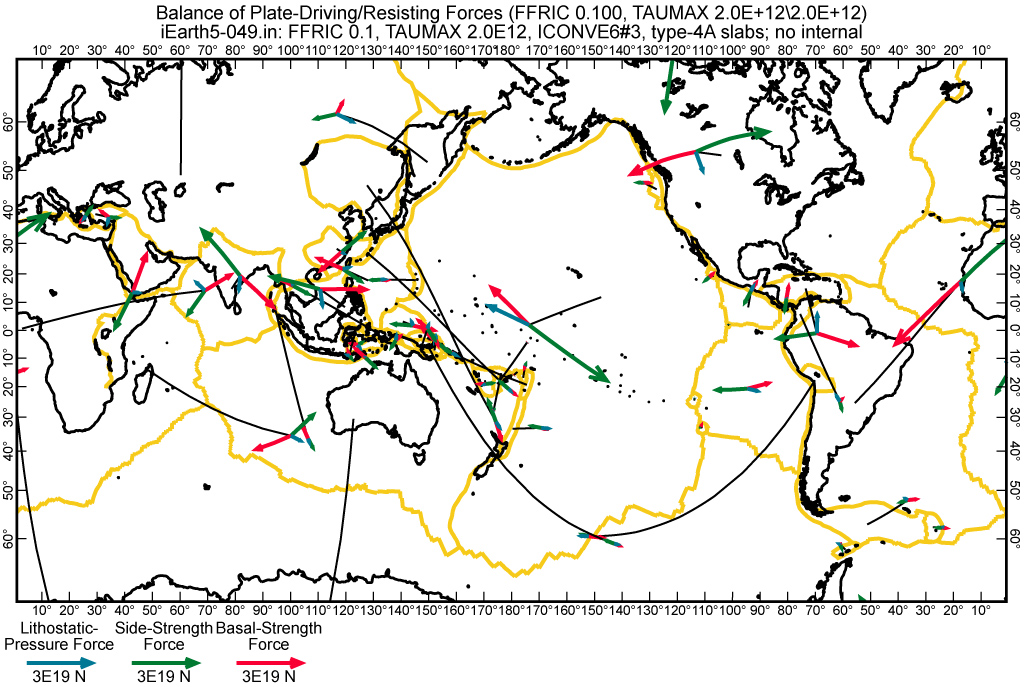
Figure 15. Triplets of ficticious point forces which are equivalent to balanced lithostatic-pressure, side-strength, and basal-strength torques on each plate, in the preferred finite-element model Earth5-049. Each triplet of point forces is connected by a black leader line to the center of the relevant plate. For leader lines which extend toward the poles, see Fig. 16.
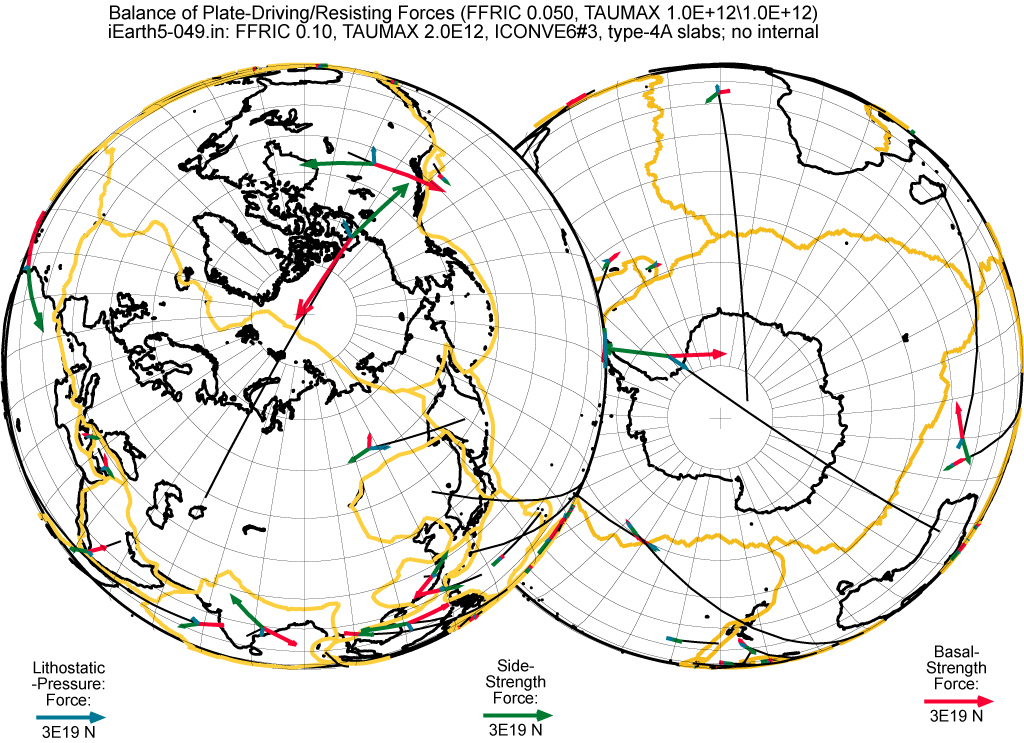
Figure 16. Polar orthographic projections of triplets of ficticious point forces, as explained in Figure 15. Each triplet of point forces is connected by a black leader line to the center of the relevant plate. For leader lines which extend toward the equator, see Figure 15.
Supplemental Figure. (This figure was not included in the published paper; I drew it later for a class.)