59. Bird, P., Y. Y. Kagan, D. D. Jackson, F. P. Shoenberg, & M. J. Werner [2009] Linear and nonlinear relations between relative plate velocity and seismicity, Bull. Seismol. Soc. Am., 99(6), 3097-3113, doi:10.1785/0120090082, with electronic supplements.
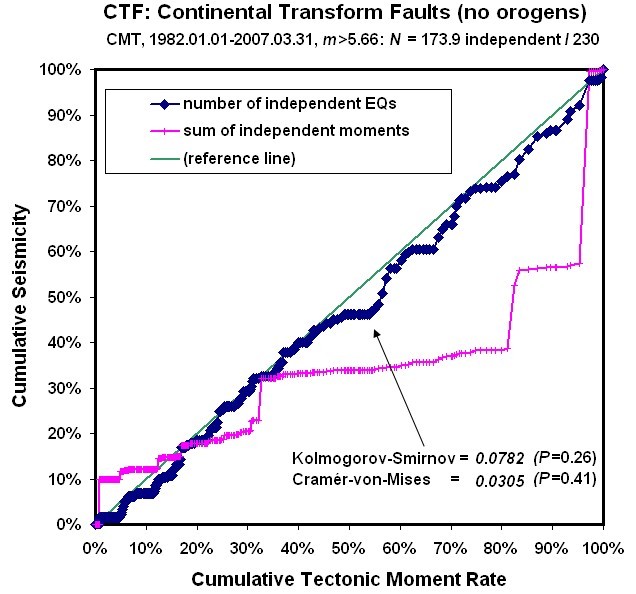
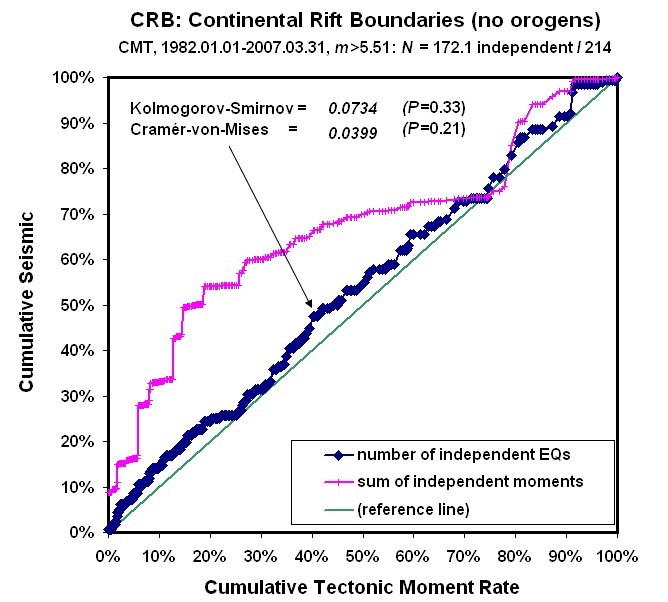
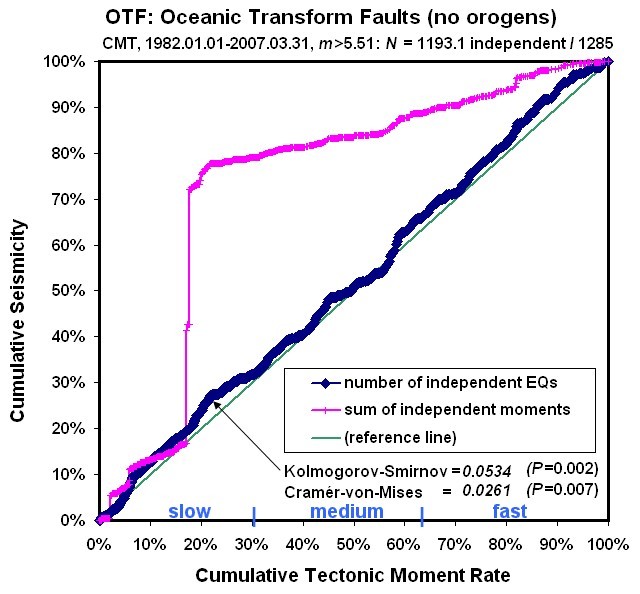
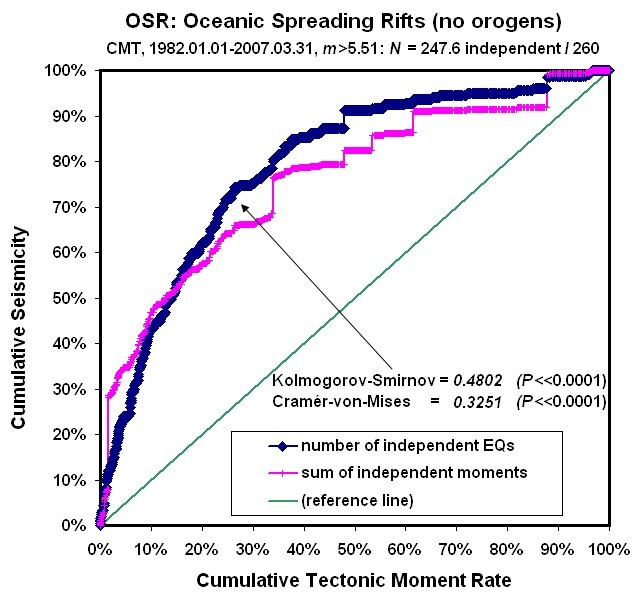
Abstract. Relationships between relative plate velocity and seismicity differ by plate boundary class. We test the null hypothesis of linearity of earthquake rates with velocity in each of 7 classes. A linear relationship is expected if earthquake rate is proportional to seismic moment rate, which is proportional to relative plate velocity. To reduce bias by aftershocks and swarms, we estimate independence probabilities of earthquakes and use them as weights. We assign shallow earthquakes to boundary steps and classes, then sort boundary steps within each class by velocity, and plot cumulative earthquakes against cumulative model moment rate. We use 2 measures of nonlinearity, and 104 stochastic simulations to assess significance. In subduction zones the relationship between seismicity and velocity is nonlinear with 99.9% confidence. Slower subduction at <66 mm/a (producing 35% of tectonic moment under the null hypothesis) produces only 20% of subduction earthquakes. Continental convergent boundaries display similar nonlinearity (P < 0.001 for the null hypothesis). Ocean spreading ridges show seismicity decreasing with velocity. Oceanic transform faults and oceanic convergent boundaries show marginal nonlinearity (P < 0.01; P < 0.05). Continental rifts and continental transform faults follow the null hypothesis. Three effects may contribute to velocity-dependence in subduction: (1) The brittle/ductile transition at a critical temperature is advected deeper by faster underthrusting; (2) subducted sediment is viscous, so lower stresses in slower boundaries discourage earthquakes; (3) pore pressures increase with velocity, encouraging frictional failure. Mechanism (1) has only minor effects on earthquake productivity, but mechanisms (2) and (3) could be important.
complete final manuscript with figures
FIGURES
.
Figure 1. Cumulative independent earthquake count (diamonds) and cumulative independent seismic moment (crosses) of Continental Transform Fault plate-boundary steps, ordered by relative plate velocity from slow on left to fast on right. Abscissa is cumulative model tectonic moment rate, assuming constant coupled seismogenic thickness, constant spectral slope, and constant corner magnitude. Diagonal reference line represents the null hypothesis of linearity.
.
Figure 2. Cumulative independent earthquake count (diamonds) and cumulative independent seismic moment (crosses) of Continental Rift Boundary plate-boundary steps, ordered by relative plate velocity. Conventions as in Figure 1.
.
Figure 3. Cumulative independent earthquake count (diamonds) and cumulative independent seismic moment (crosses) of Oceanic Transform Fault plate-boundary steps, ordered by relative plate velocity. Conventions as in Figure 1.

.
Figure 4. Cumulative independent earthquake count (diamonds) and cumulative independent seismic moment (crosses) of Oceanic Convergent Boundary plate-boundary steps, ordered by relative plate velocity. Conventions as in Figure 1.
.
Figure 5. Cumulative independent earthquake count (diamonds) and cumulative independent seismic moment (crosses) of Oceanic Spreading Ridge plate-boundary steps, ordered by relative plate velocity.
.
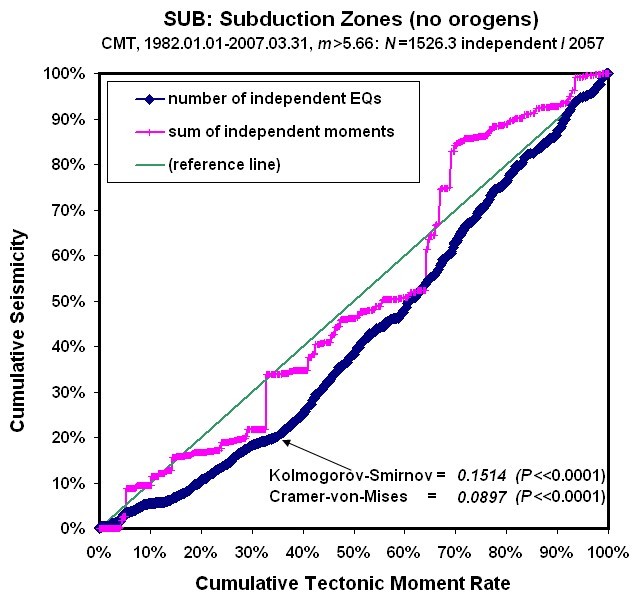
Figure 6. Cumulative independent earthquake count (diamonds) and cumulative independent seismic moment (crosses) of Subduction-zone plate-boundary steps, ordered by relative plate velocity.
.
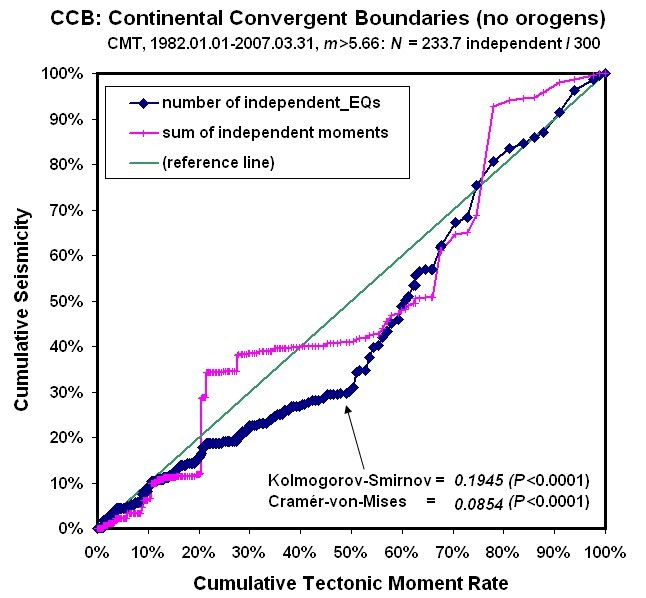
Figure 7. Cumulative independent earthquake count (diamonds) and cumulative independent seismic moment (crosses) of Continental Convergence Zone plate-boundary steps, ordered by relative plate velocity.
.
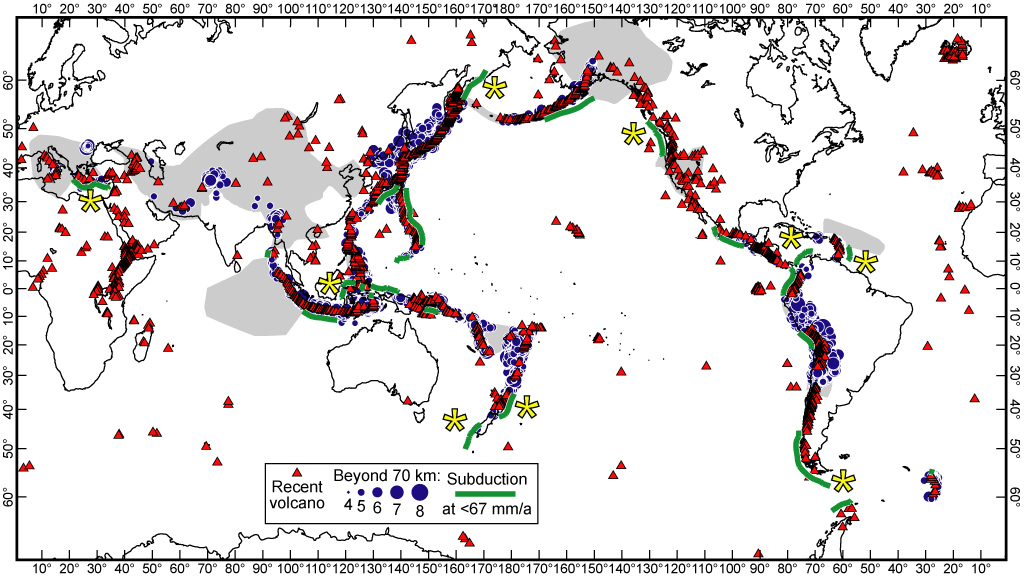
Figure 8. “Slow” subduction zones (v < 67 mm/a; heavy green lines) outside orogens (shading) from the PB2002 model of Bird [2003], who defined them as convergent boundaries with associated volcano(es) (triangles) and/or Wadati-Benioff zones of intermediate-depth seismicity (circles). Large asterisks indicate slow subduction zones that were not included in the “Subduction zone deformation regime” of Kreemer et al. [2002]. Earthquakes deeper than 70 km are from CMT and volcanoes are from Simkin & Siebert [1995].
.
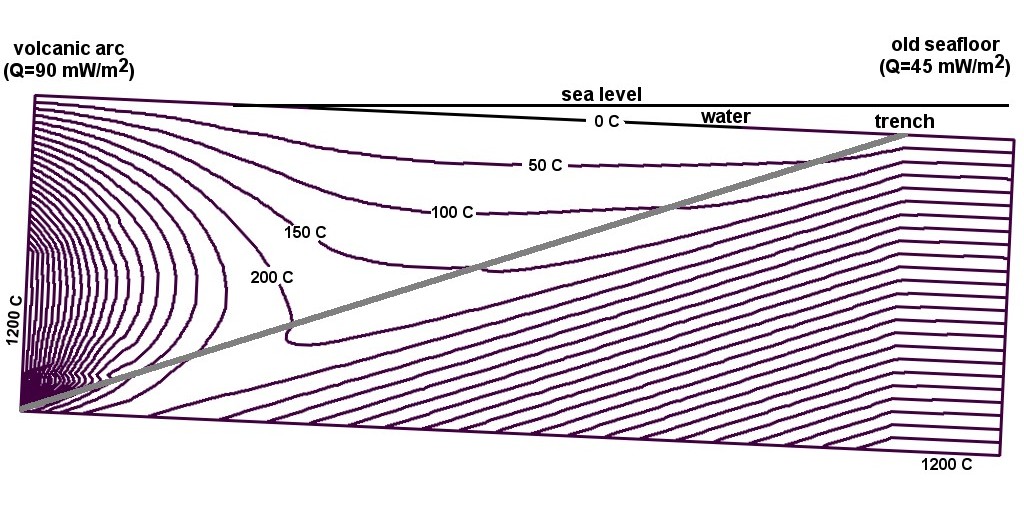
Figure 9. Thermal structure of a vertical cross-section of a model subduction zone, after 100 m.y. of subduction at 60 mm/a. The F-D grid has been rotated for greater realism, as explained in text. Geotherms of the subducting oceanic plate (right) and the volcanic arc (left) were fixed as boundary conditions. Diagonal line indicates the interplate shear zone. Contour interval 50 C.
.
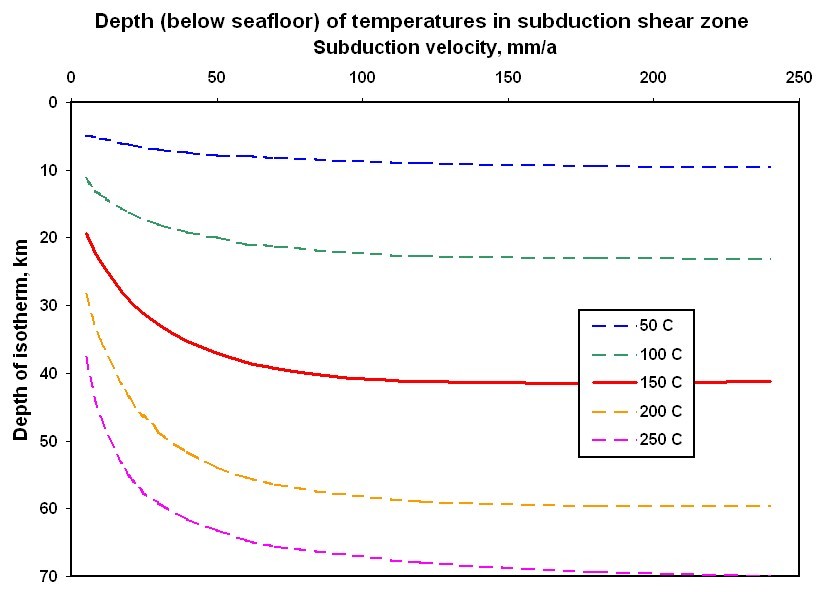
Figure 10. Depths (below seafloor) to various temperatures in the interplate shear zone, from F-D thermal models like that shown in Figure 9. The 150 C isotherm is suggested as an estimate of the lower limit of the (potentially) frictional and seismogenic portion of the shear zone.

.
Figure 11. Potentially seismogenic lithosphere thicknesses, expressed as depth extents of the (potentially) seismogenic portion of the interplate subduction shear zone. Obtained from Figure 10 by subtraction of a constant 12.4 km depth to the beginning of the seismogenic zone.

.
Figure 12. Estimated variations in corner magnitude of shallow subduction zone earthquakes due solely to velocity-dependent variations in thermal structure, as shown in Figures 10-11. Fixed point is the global average value of Bird & Kagan [2004], plotted at the relative plate velocity of the 1960 Chilean earthquake. In very slow subduction, plate-bending earthquakes may dominate the corner magnitude.

.
Figure 13. Global-average histograms of shallow earthquake counts, by focal mechanism, in subduction zones of the PB2002 model (outside designated orogens). Width of all bins is 10 km. Thrusting earthquakes located to the right of the trench probably did not occur on the interplate shear zone, but were due to plate bending. Some thrusting earthquakes to the left of the trench were also due to plate bending. By estimating that plate-bending produces equal numbers of normal and thrusting earthquakes, we compute the fraction of earthquakes taking place on the interplate shear zone to be 100% - 9.4% - 2 x 14.5% = 62%.
.
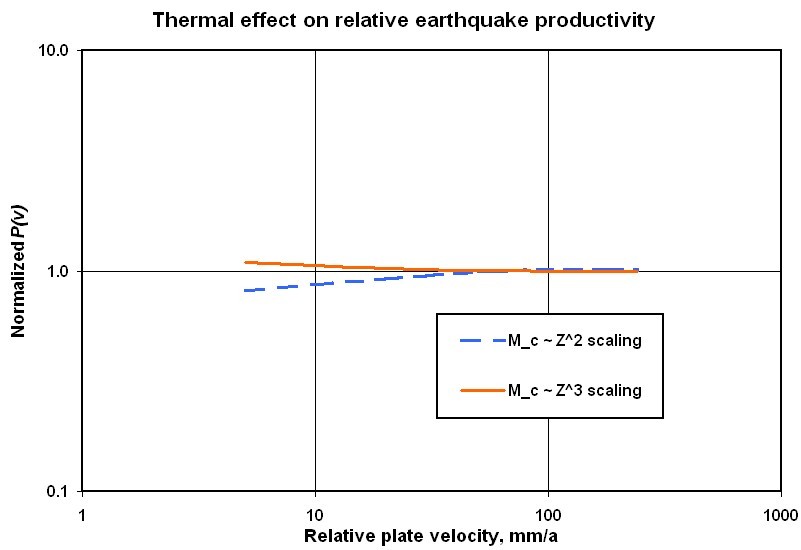
Figure 14. Normalized earthquake productivity (defined in text) variations predicted from the F-D thermal models of Figures 9-12, and the observed earthquake partitioning in subduction zones from Figure 13. Greater seismogenic lithosphere thickness at higher velocity is offset by the effect of higher corner magnitude, predicting roughly uniform productivity.
.
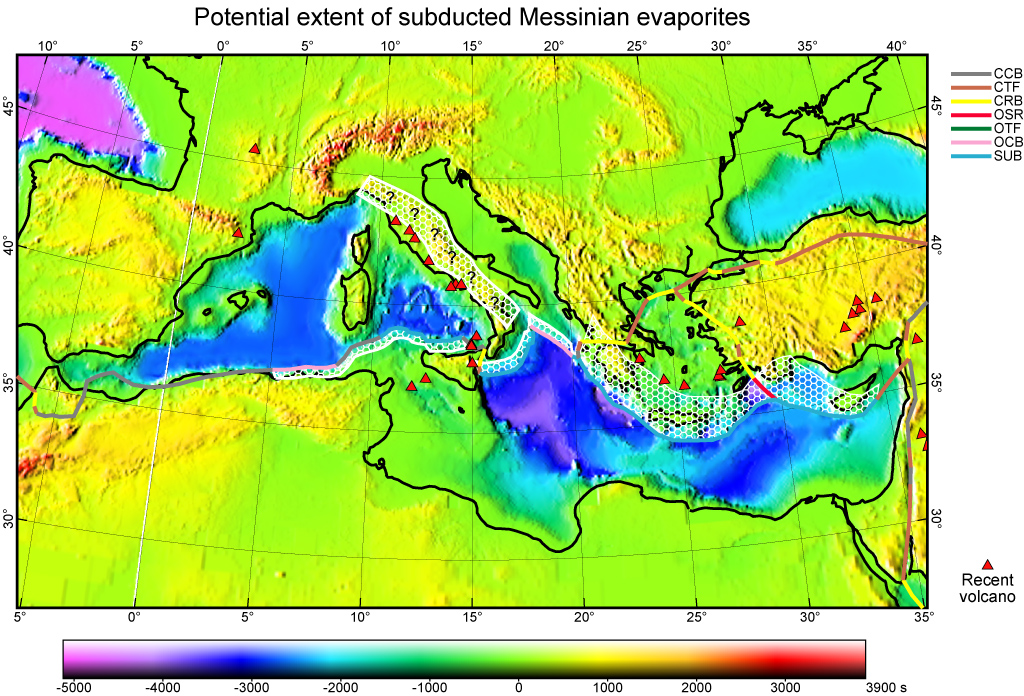
Figure 15. Potential extent of subducted evaporite sediments (white honeycomb pattern) based on present plate velocities from PB2002 [Bird, 2003] and an assumption that some evaporites travel at the velocity of the subducting plate (AF or EU). Evaporites under the Italian peninsula are hypothetical, and depend on both the past motion of the peninsula with respect to Adria [here based on Figure 6 of Rosenbaum et al., 2008], and whether a suitably deep basin existed for Messinian evaporite formation off the former southwestern continental margin of the Adria microcontinent, prior to its collision with Italy.
.
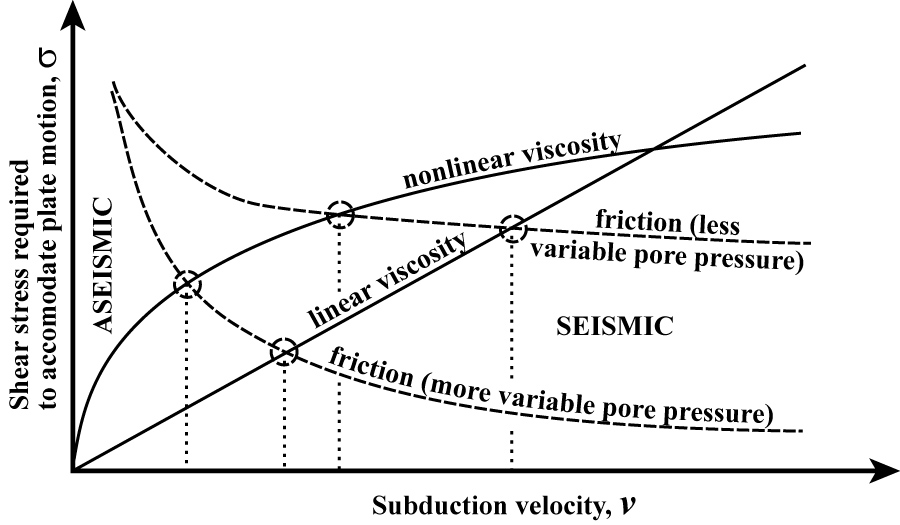
Figure 16. Schematic diagram of possible conditions at intermediate depth (e.g., 27 km below sea level) in an interplate subduction shear zone. The shear stress necessary to accommodate relative plate motion by viscous flow (solid lines) might increase linearly or according to a power-law. The shear stress necessary for frictional sliding (dashed curves) is controlled by pore pressure, whose sensitivity to plate velocity is unknown. Their intersection (at one of the 4 circled points) would divide low-velocity aseismic behavior from high-velocity seismic behavior at this particular point in the shear zone.