62. Howe, T. C., and P. Bird [2010] Exploratory models of long-term crustal flow and resulting seismicity in the Alpine-Aegean orogen, Tectonics, 29, TC4023, doi: 10.1029/2009TC002565.
Abstract. Long-term crustal flow is computed with a kinematic finite-element model based on iterated weighted-least-squares fits to data and prior constraints. Data include 773 fault traces, 106 fault offset rates, 510 geodetic velocities, 2566 principal stress azimuths, and velocity boundary conditions representing the rigid parts of the Eurasia, Africa, and Anatolia plates. Model predictions include long-term velocities, fault slip rates, and distributed permanent strain rates between faults. One model assumes that geodetic velocities measured adjacent to the Aegean Trench reflect a temporarily-locked subduction zone; in this case long-term subduction velocity averages 45 mm/a and rapid crustal extension is predicted in the southern Aegean Sea. Another model assumes steady creeping subduction; in this case subduction velocity averages only 29 mm/a and the eastern Aegean Sea floor is predicted to be more nearly rigid. Long-term seismicity maps are computed for each model, based on the SHIFT hypotheses and previous global calibrations of plate-boundary earthquake production. Retrospective comparisons to seismic catalogs are encouraging: map patterns, spatial distribution functions, and total earthquake counts are all comparable. While neither model accurately predicts earthquake rates at all magnitudes, the creeping-subduction model is more accurate for strong m6+ events, which dominate the seismic hazard.
Input and output files for/from neotectonic modeling of the Alpine-Aegean orogen
Long_Term_Seismicity software for long-term seismicity forecasts
Long-term seismicity forecast of shallow earthquakes in the Alpine-Aegean region
 .
.
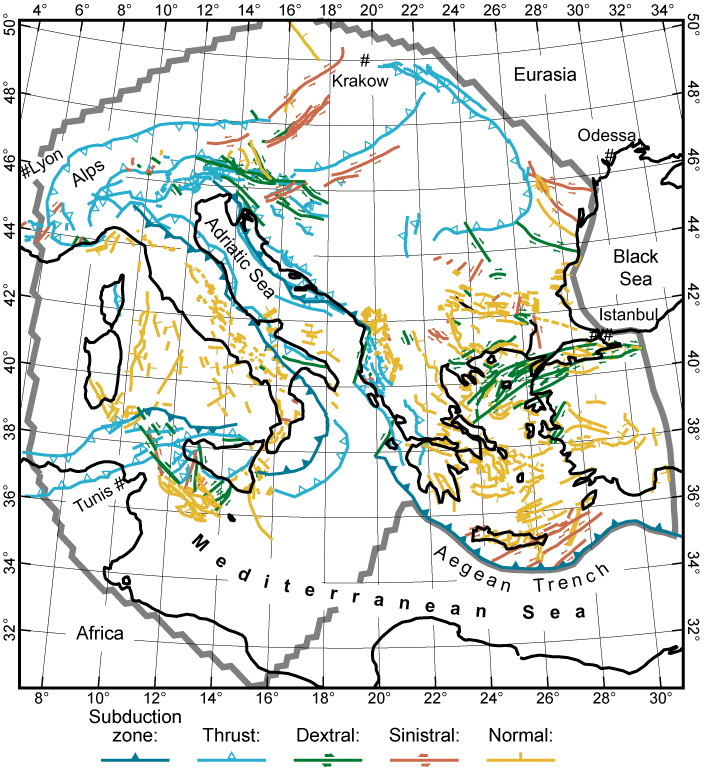
Figure 1. Traces of active and potentially-active faults within the Alpine-Aegean orogen (heavy grey outline) included in modeling. Dip ticks indicate nominal senses of slip, but faults lacking geologic offset rates are free to slip with opposite sense. Polyconic projection.
 .
.
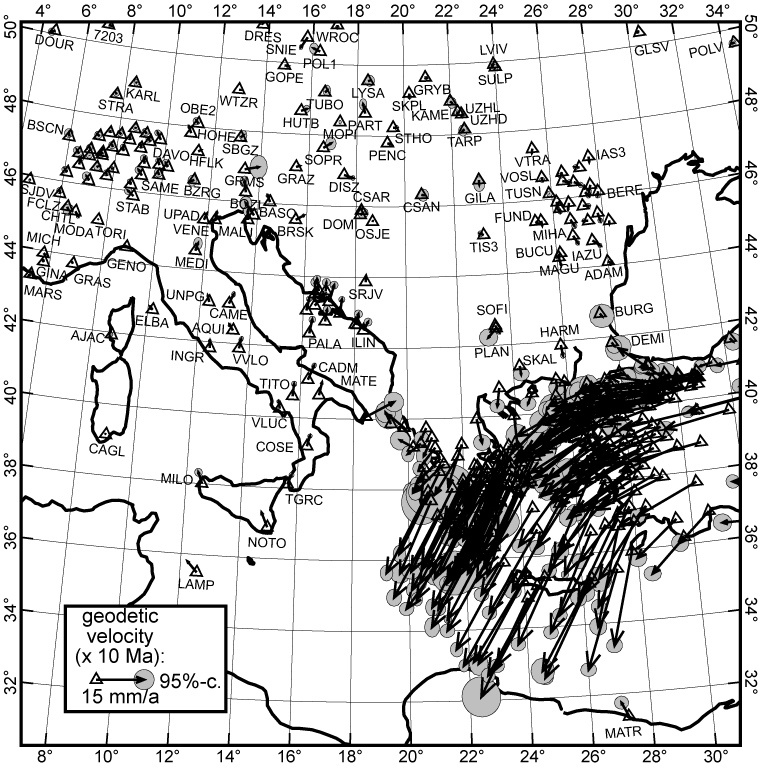
Figure 2. GPS velocities selected from literature, with 90%-confidence ellipses. Velocity is extrapolated forward for 107 years. Some benchmark codes omitted for clarity.
 .
.
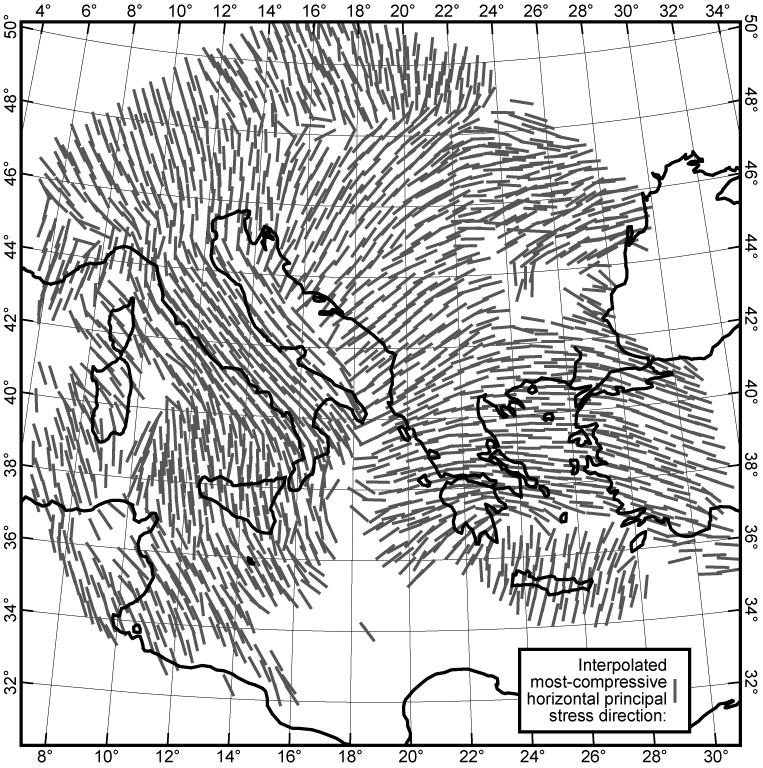
Figure 3. Azimuths of the most-compressive horizontal principal stress direction, as interpolated by NeoKinema using the clustered-data method of Bird & Li [1996]. Symbols are omitted if 90%-confidence sectors (not shown) are broader than ±45°. For clarity, only 1/4 of interpolated directions are plotted.
 .
.
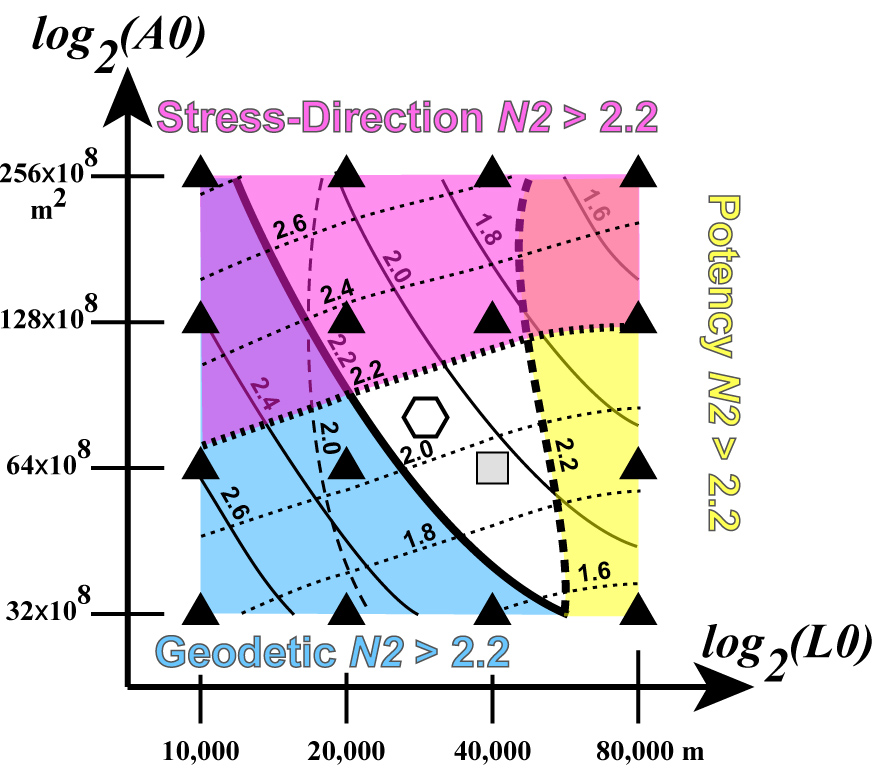
Figure 4. Root-mean-square misfits (dimensionless measures, defined in equations 2-4) of NeoKinema models, as functions of dimensional weight parameters L0 and A0 (defined in text). Unsuccessful models with sup(N2) > 2.2 are shown by solid triangles, successful model in regular grid-search is shown by gray square, and the preferred model is shown by open hexagon.
 .
.
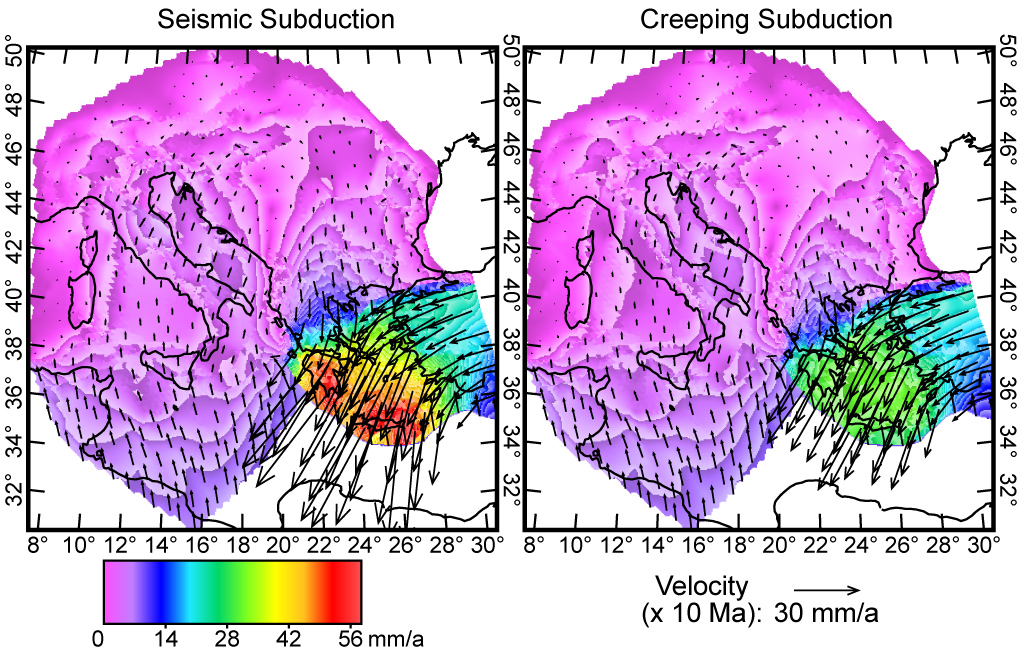
Figure 5. Long-term-average velocity fields of the seismic subduction model (left) and the creeping subduction model (right). Velocity vectors are extrapolated forward for 107 years. For clarity, only 1/9 of computed nodal velocities are plotted as vectors. Contour interval of shading is 1 mm/a. Velocity reference frame is stable Eurasia to the north.
 .
.
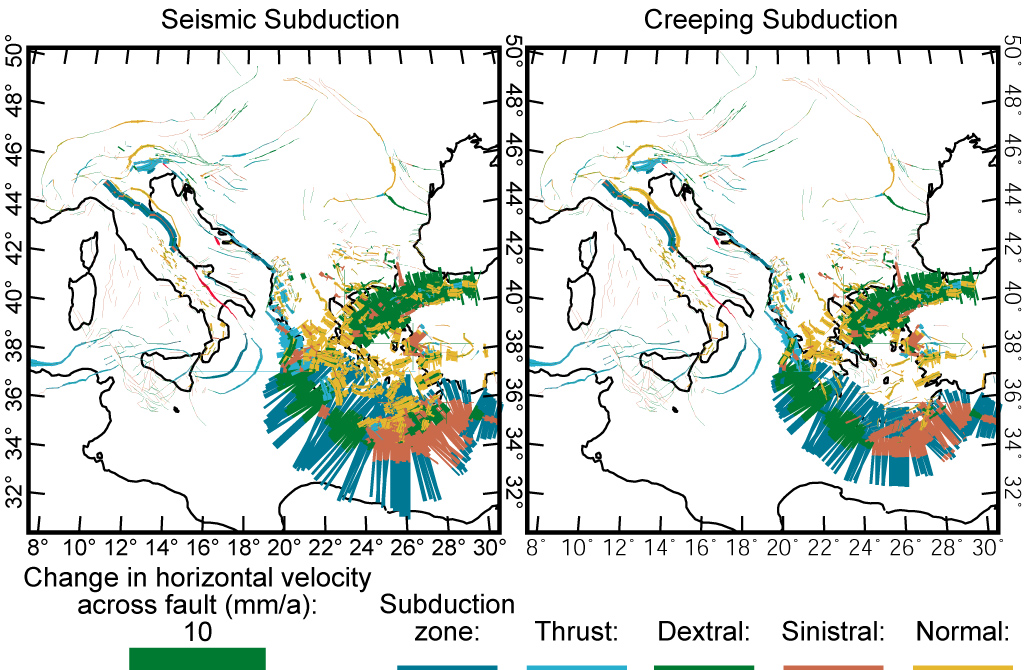
Figure 6. Fault heave rates predicted by the seismic subduction model (left) and the creeping subduction model (right). Faults with oblique slip are represented by two superposed colored ribbons. Note that the seismic subduction model predicts both faster subduction (blue bands) and faster extension (yellow traces) in the southern Aegean Sea.
 .
.
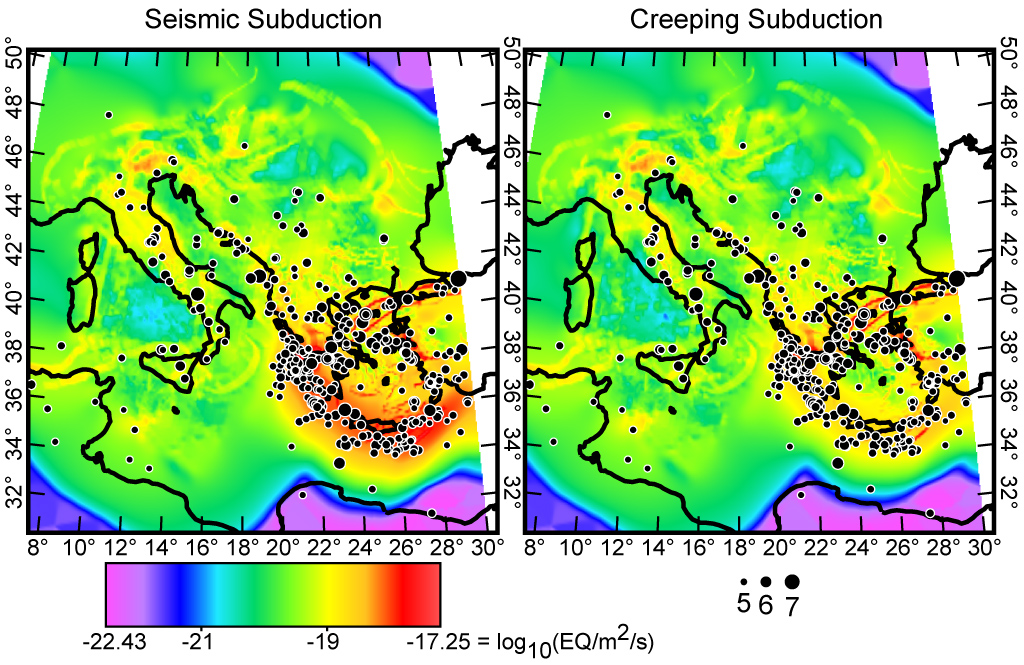
Figure 7. Long-term rates of shallow (< 70 km) seismicity for magnitudes m > 5 forecast by the seismic subduction model (left) and the creeping subduction model (right). Epicenters (identical in both frames) are of shallow m > 5 earthquakes from the Global Centroid Moment Tensor catalog, 1977-2008.
 .
.
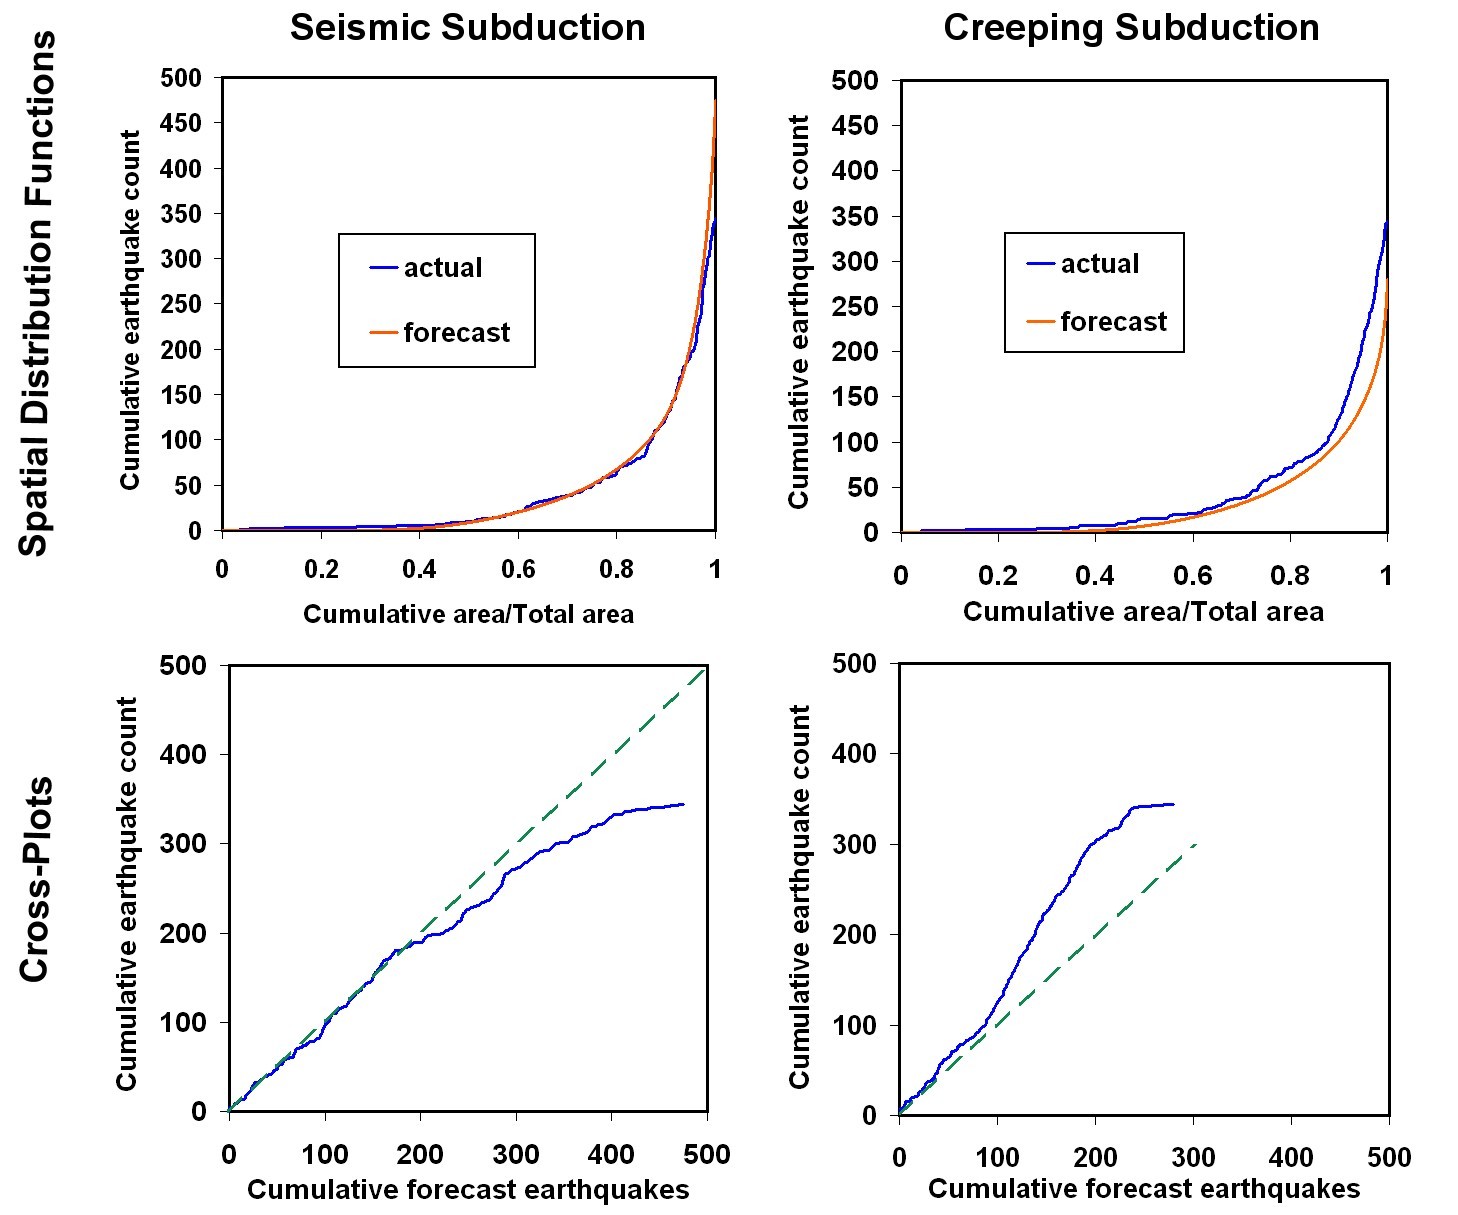
Figure 8. Spatial distribution
functions (SDFs, defined in text) for the seismic subduction model (top left)
and the creeping subduction model (top right). Each plot in top row shows both
forecast and actual seismicity, both as functions of cumulative area. Bottom
row shows cross-plots of actual SDFs as a function of forecast SDFs; here the
ideal is a diagonal line (dashed line). For threshold m > 5, actual
seismicity is less than forecast by the seismic-subduction model but more than
forecast by the creeping-subduction model; in each case the discrepancy occurs in
the forecast high-seismicity areas (right part of each graph). The shift to a
preference for the creeping-subduction model as threshold magnitude is raised
above 5 is shown in Table 1.