66. Petersen, M. D., Y. Zeng, K. M. Haller, R. McCaffrey, W. C. Hammond, P. Bird, M. Moschetti, Z. Shen, J. Bormann, and W. Thatcher [2014] Geodesy- and geology-based slip-rate models for the Western United States (excluding California) national seismic hazard maps, U.S. Geol. Surv. Open-File Rep., 2013-1293, 38 pages (main report) + 5 Appendices, http://dx.doi.org/10.3133/ofr20131293.
includes:
Bird, P. [2014] Appendix C—Estimation of fault slip rates in the
conterminous western United States with statistical and kinematic
finite-element programs. 10 pages.
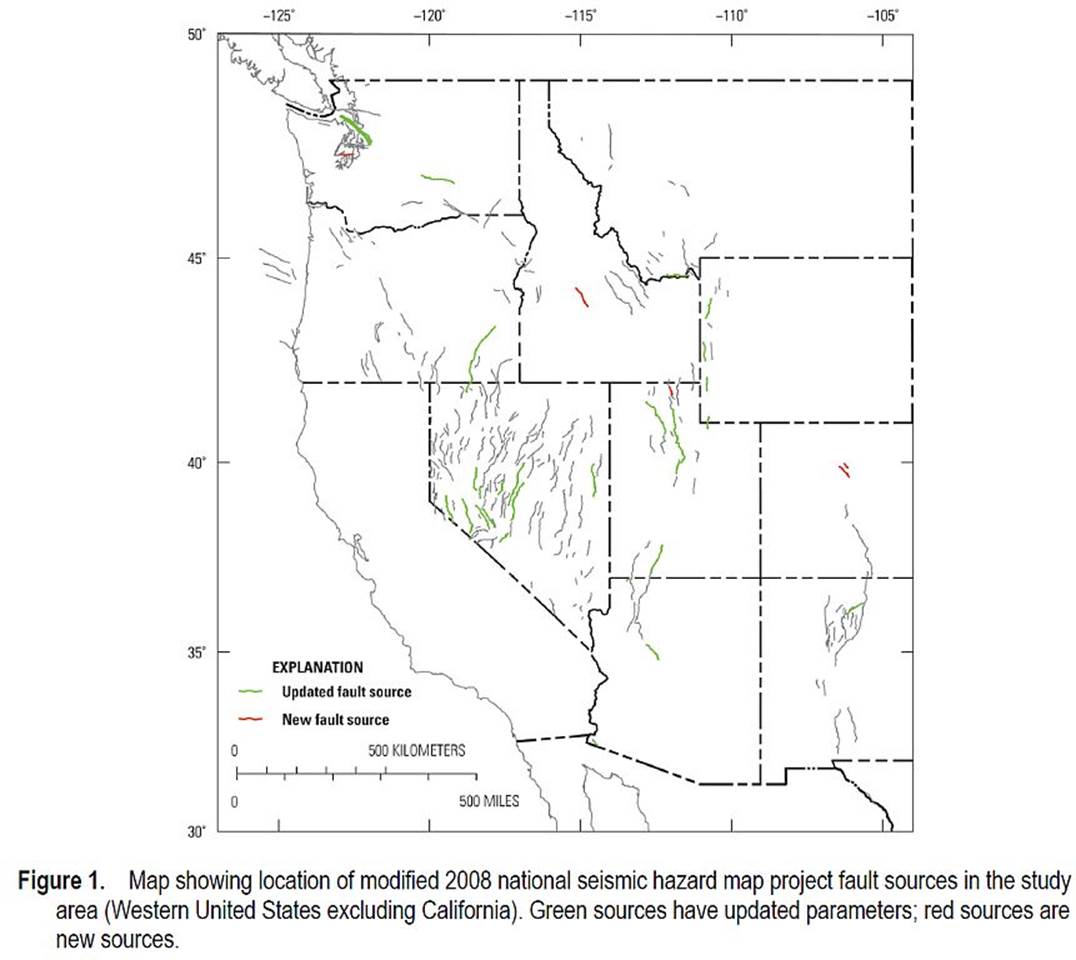
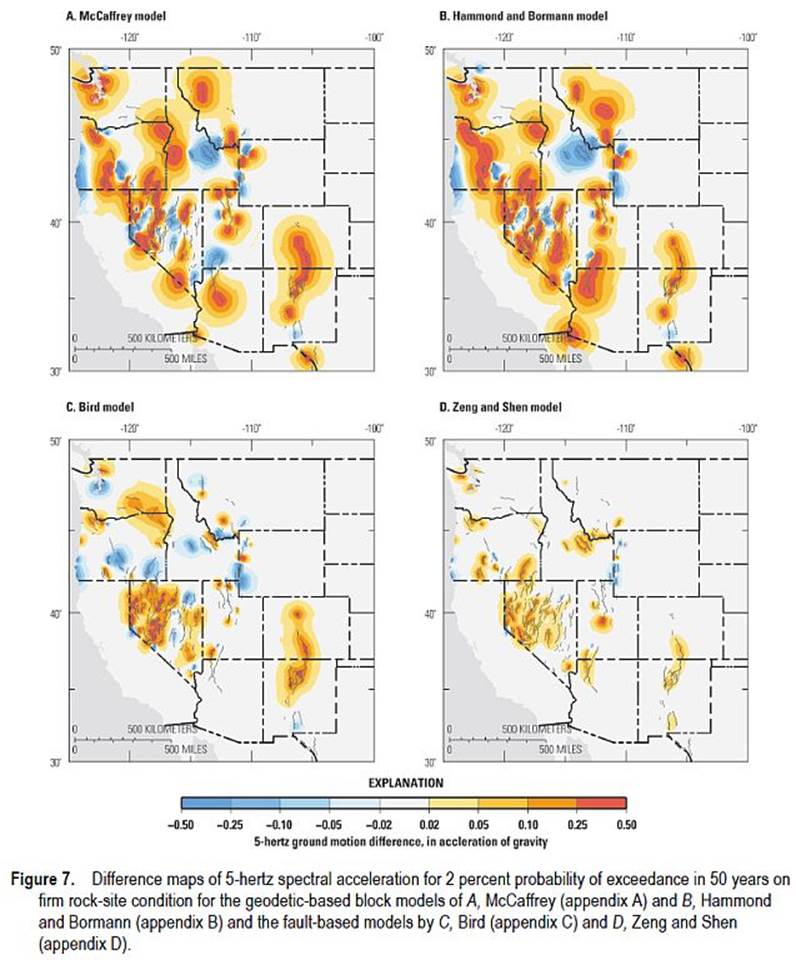
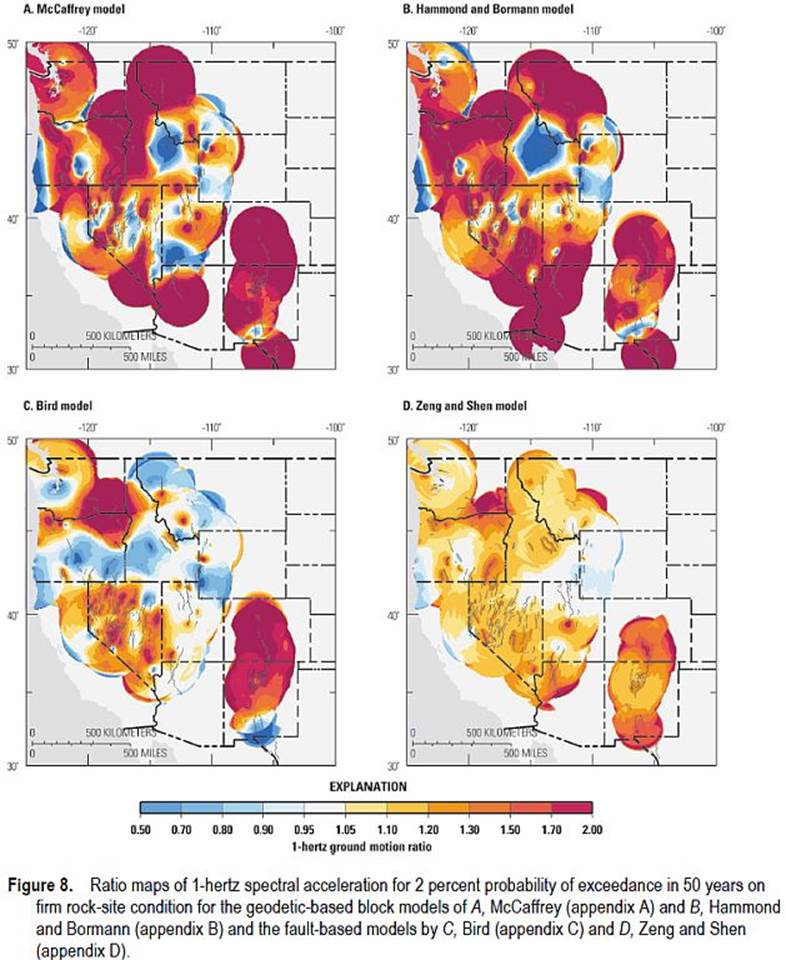
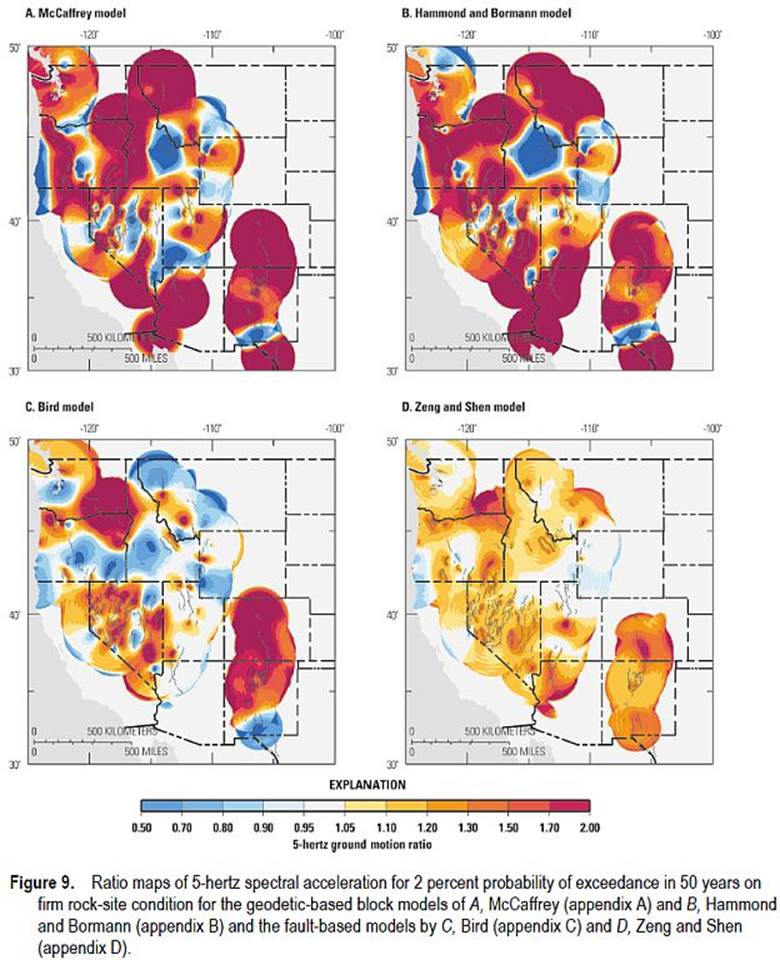
[Main report] Abstract. The 2014 National Seismic Hazard Maps for the conterminous United States incorporate additional uncertainty in fault slip-rate parameter that controls the earthquake-activity rates than was applied in previous versions of the hazard maps. This additional uncertainty is accounted for by new geodesy- and geology-based slip-rate models for the Western United States. Models that were considered include an updated geologic model based on expert opinion and four combined inversion models informed by both geologic and geodetic input. The two block models considered indicate significantly higher slip rates than the expert opinion and the two fault-based combined inversion models. For the hazard maps, we apply 20 percent weight with equal weighting for the two fault-based models. Off-fault geodetic-based models were not considered in this version of the maps. Resulting changes to the hazard maps are generally less than 0.05 g (acceleration of gravity). Future research will improve the maps and interpret differences between the new models.
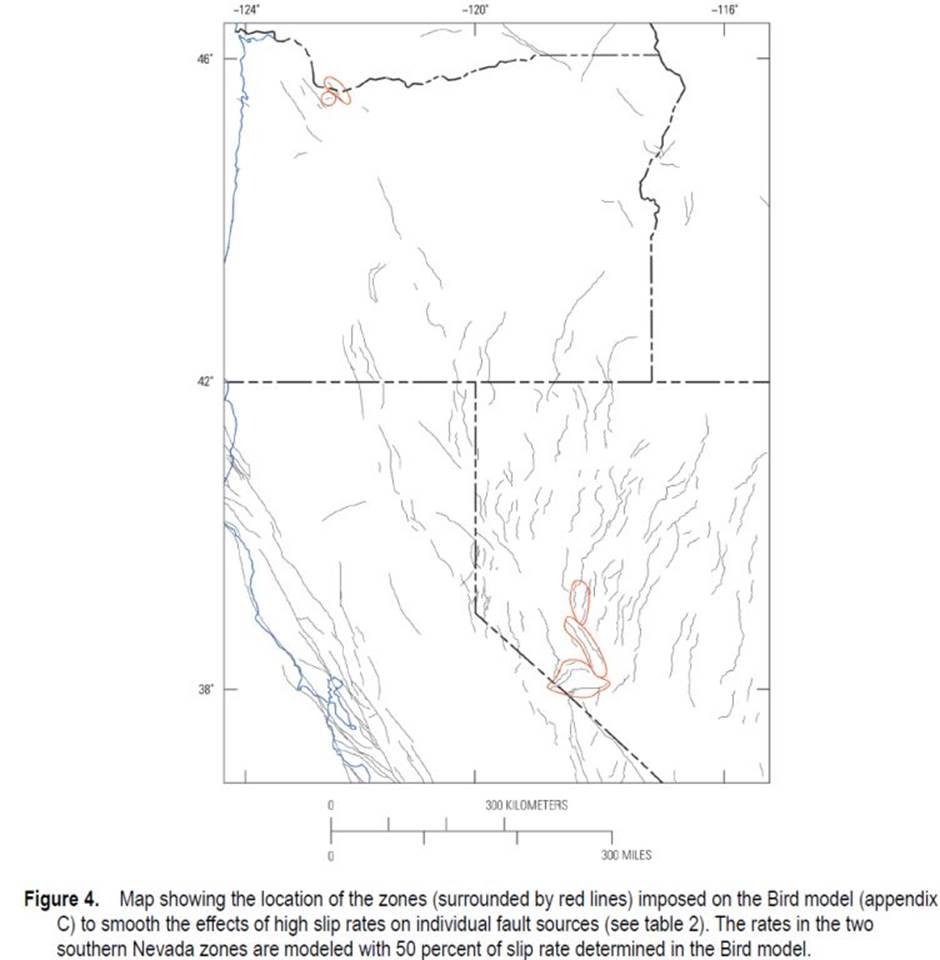
[Appendix C] Overview. The estimated fault slip rates obtained from models NSHM-WUS_2013001 and NSHM-WUS_2013002 (which are referred to as “the Bird fault-based model” in the accompanying report) were obtained through three sequential processing steps:
1. Statistical modeling of geologic offset-rates with program Slippery. Direct evidence from dated offset features on each fault and (or) indirect evidence from dated offset features on other faults of the same type in the same tectonic province are combined to obtain the “pure-geologic” probability density function (PDF) for each component of offset-rate on each fault. Additional constraints such as geometric compatibility, plate tectonics, geodesy, and stress directions are not used in this phase of the study.
2. Joint geologic and geophysical inversion for offset rates with program NeoKinema. The “pure-geologic” offset rates from the previous step (with their uncertainties) are combined and balanced against additional constraints from GPS geodesy, plate tectonics, geometric compatibility (such as, continuum stiffness), and principal stress directions. A kinematic finite-element solution with program NeoKinema provides trace-averaged mean offset rates for each component of offset on each fault. A simple post-processing step combines these offset-rate components with the model-fault dips to obtain the model predictions for rake and slip-rate of each fault.
3. Manual adjustments to some slip-rates in California. Following intensive review of model predictions by local geologic experts, some model predictions were adjusted to become (barely) consistent with additional information that had not been used in the previous modeling steps.
Each step is described further in a corresponding section of this appendix and most fully in the previously published papers cited below.
All programs (both source codes and executables), input datasets, output datasets, post-processed reports, and graphical map files associated with this work are available online at http://peterbird.name/oldFTP/NeoKinema/Orogens/WUS_for_UCERF3_and_NSHM2014/; readers are particularly invited to look into the folders named 3_graphics_files along each model branch.
Main report, & Appendices, online at USGS
Archive of input & output files related to my NeoKinema deformation model(s)
Note that the figures shown here are only a selection,
emphasizing those relevant to my NeoKinema deformation model.