80. Carafa, M. M. C., D. Di Naccio, C. Di Lorenzo, V. Kastelic, and P. Bird [2022] A meta-analysis of fault slip rates across the Central Apennines, J. Geophys. Res., 127(1), e2021JB023252, https://doi.org/10.1029/2021JB023252.
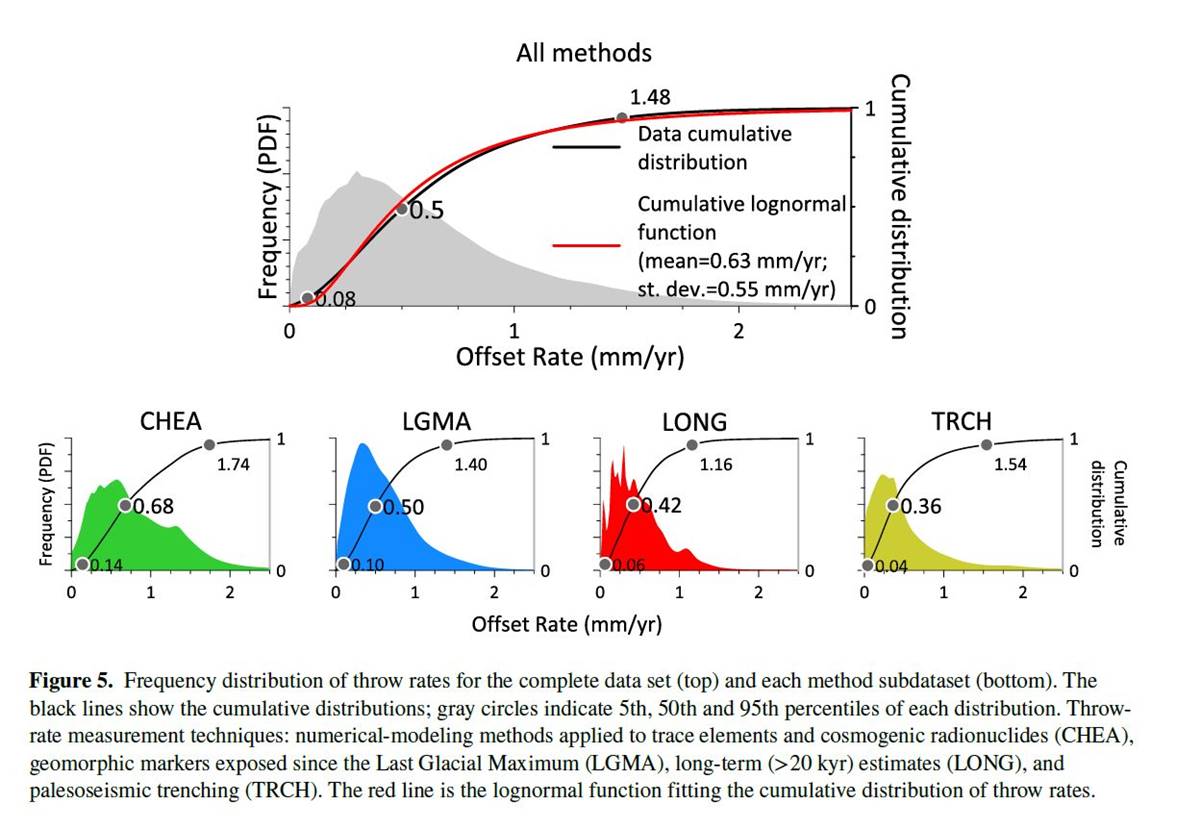
Abstract. Several methods such as paleoseismic trenching, mapping of offset geomorphic markers, and dating of scarp profiles have been used to determine slip rates of normal faults in the central Apennines. Combining measurements obtained with different methods remains challenging because non-tectonic processes can introduce noise or spurious signals that are elusive to quantify, and these influence slip rate estimates. To this end, we meta-analyzed throw measurements with associated ages collected in the central Apennines with several methods to quantify such erratic fluctuations and method-related variances. We show that throw rates are overdispersed with respect to nominal uncertainties in throw and age; therefore, they are commonly affected by unmodeled noise processes. After comparing throw rate distributions sampling the same faults with different techniques, no clear spatio-temporal patterns appear, but only quasi-random noise. Assuming that field investigators sampled real tectonic features (i.e., fault scarps), we find that such erratic throw rates indicate total uncertainties are two to three times greater than the stated observation uncertainties. In this situation, a simple and robust null hypothesis is appropriate. We propose that most faults should be assumed to have uniform throw rate along their traces, except for possible tapering near unconnected ends. We also propose that models in which throw rates are time-dependent (within the last 25 kyr) are not yet justified. Then, relying on the estimated total uncertainties, we determine the most probable long-term fault throw rate for each active fault by combining different throw-rate probability density functions.