84. Carafa, M. M. C., P. Bird, A. Verdecchia, M. Taroni, and C. Doglioni [2024] Empirical evidence for multi-decadal transients affecting geodetic velocity fields and derived seismicity forecasts in Italy, Scientific Reports, 14, 19941, https://doi.org/10.1038/s41598-024-70816-6.
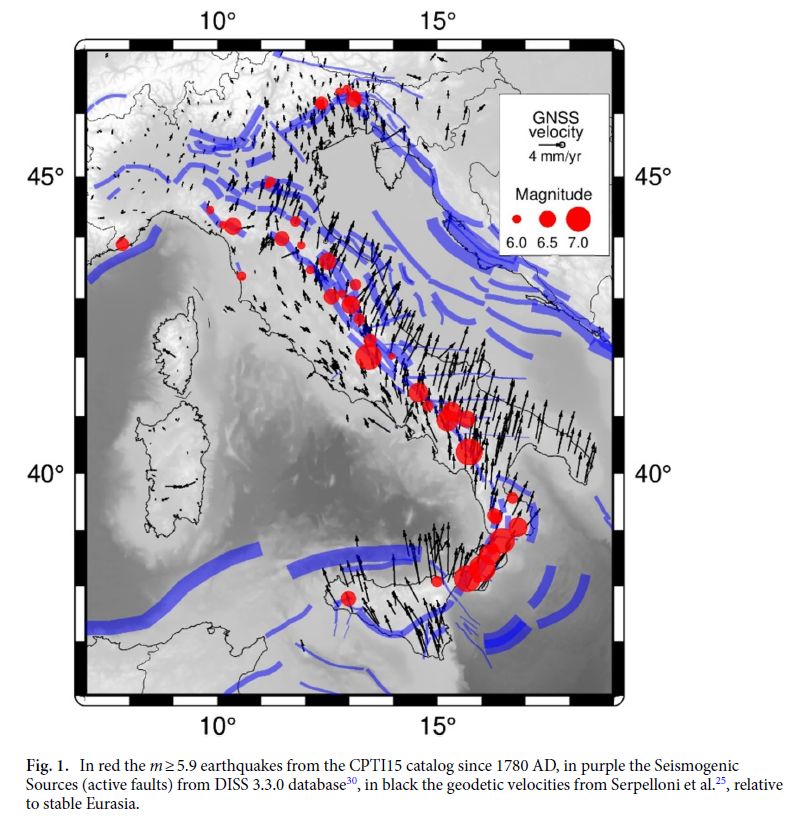
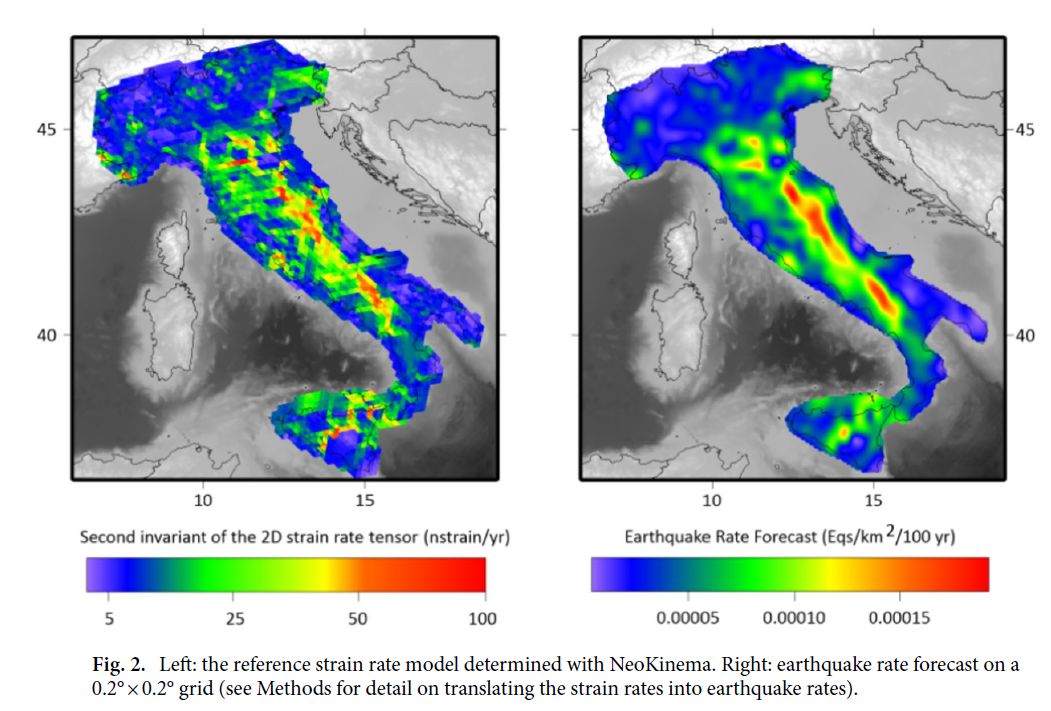
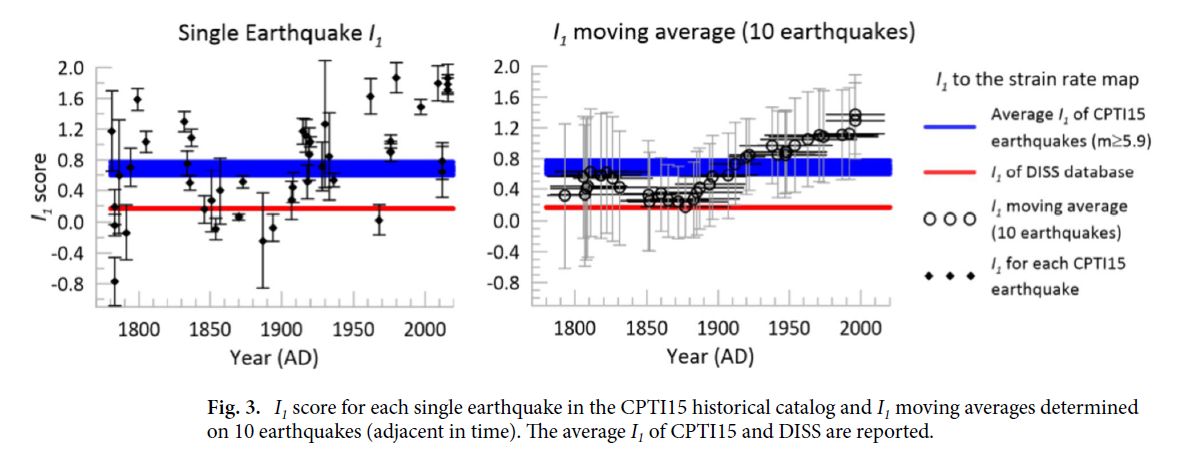
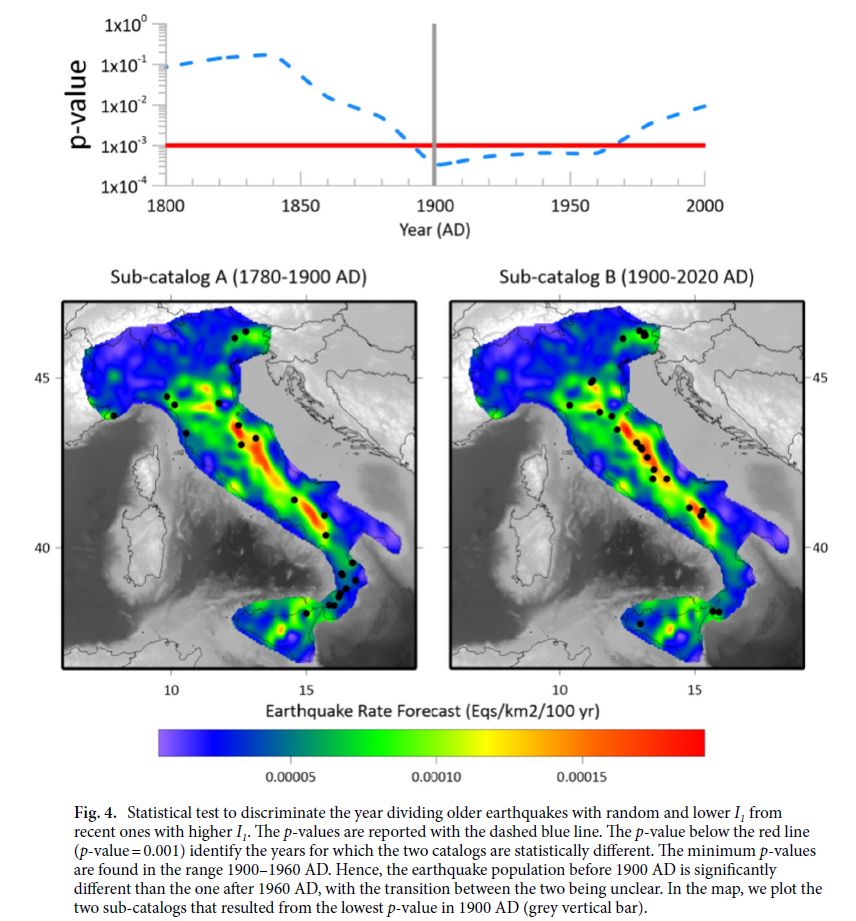
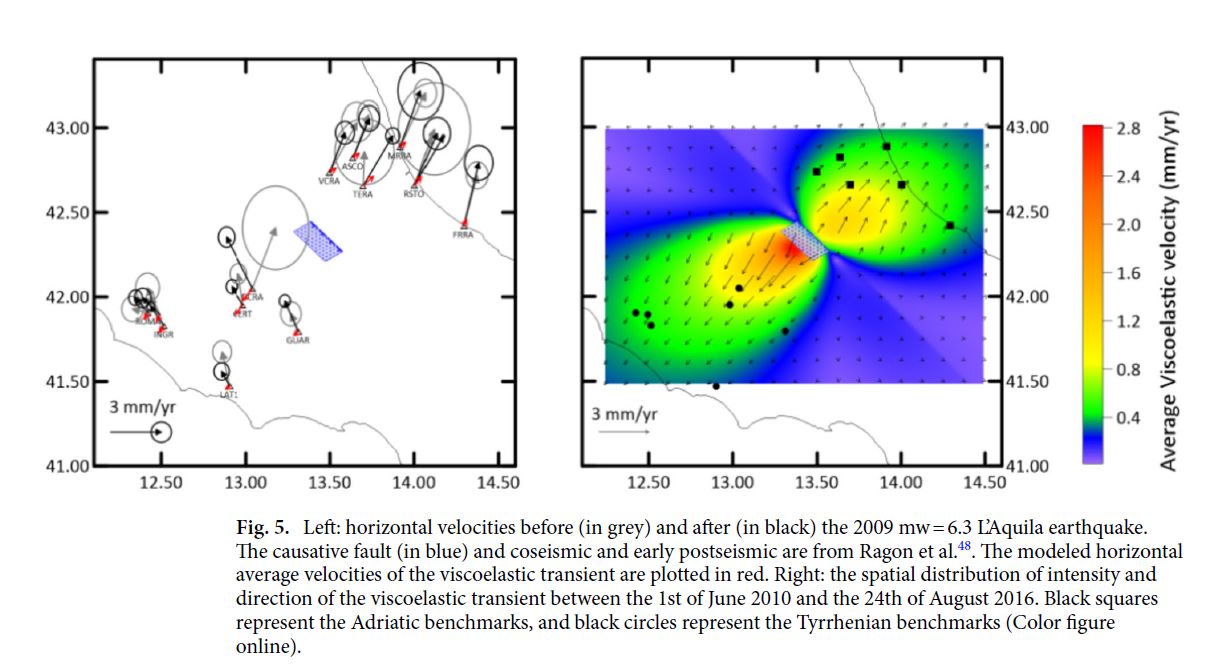
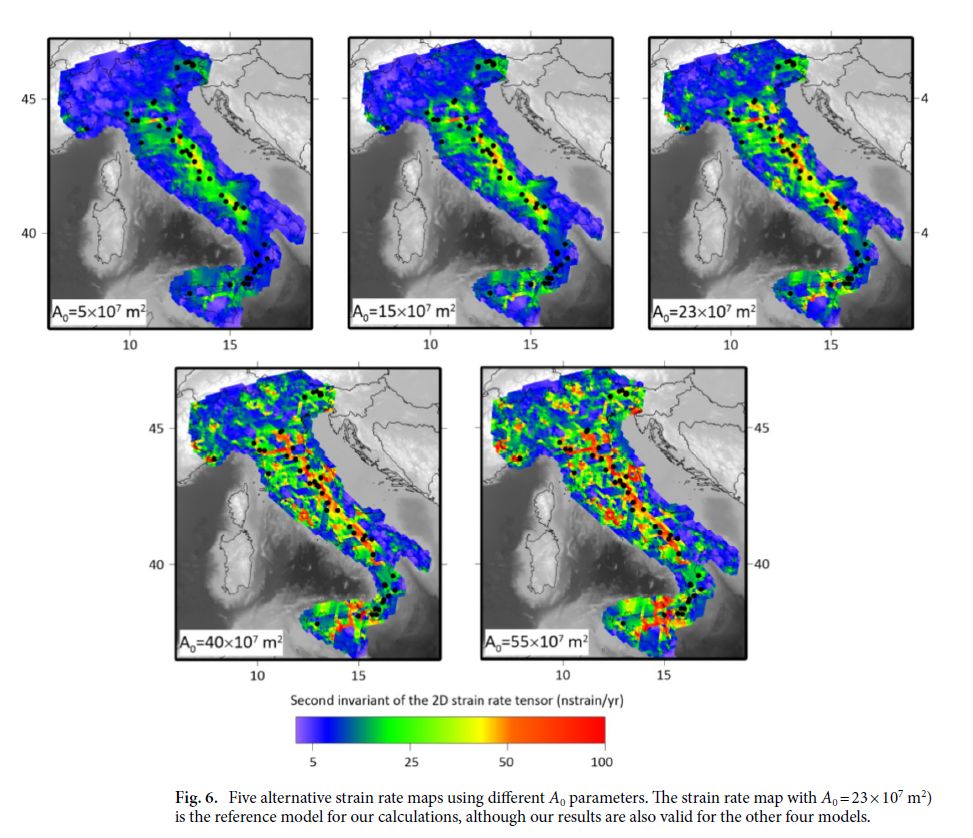
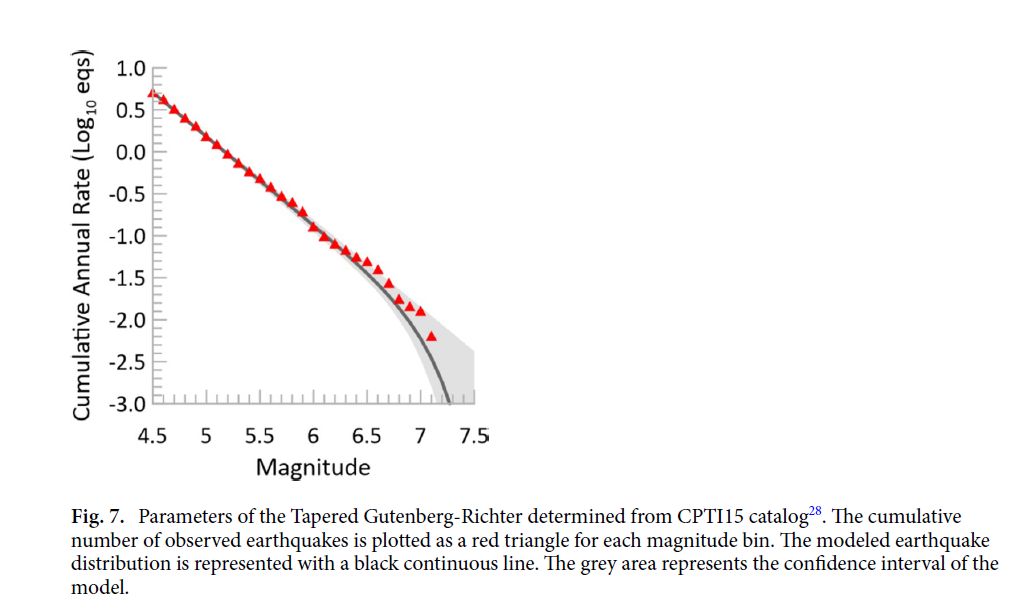
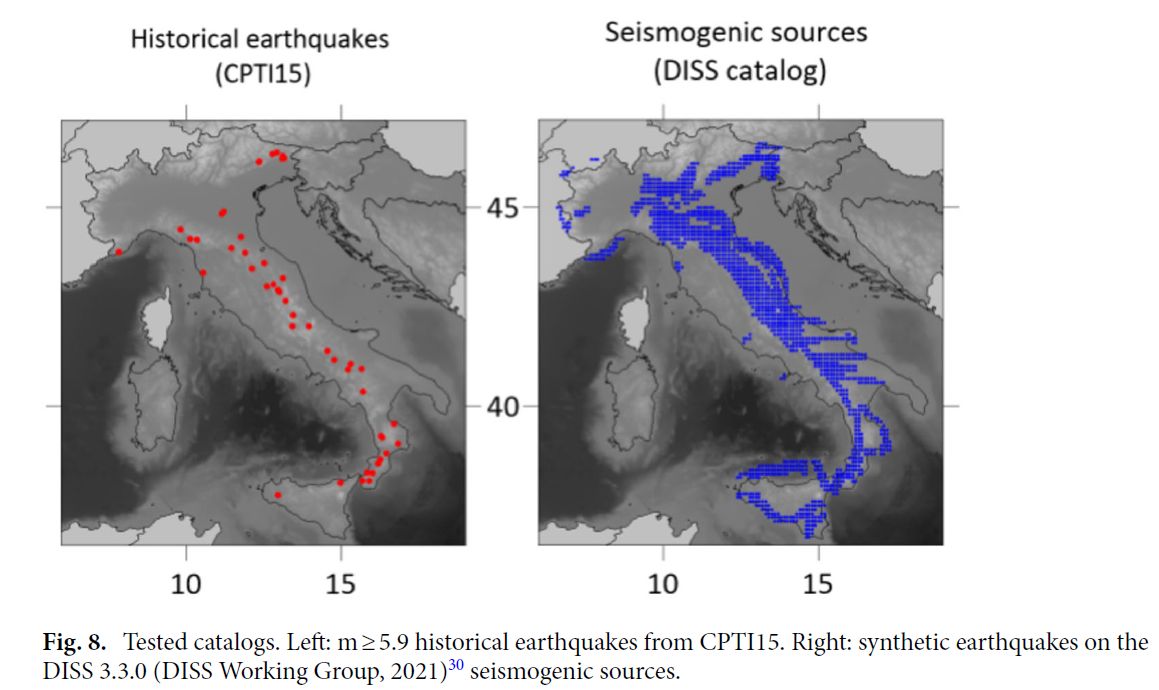
Abstract. This study critically examines the use of geodetic strain rates for forecasting long-term earthquake rates in a slow-deforming region such as Italy, challenging the prevailing assumption of their temporal stationarity in interseismic stages for seismic hazard analyses. Typically, earthquake-rate models derived from geodesy assume stationary interseismic loading rates, with stress rates in the upper crust proportional to geodetic strain rates, leading to earthquake rates directly proportional to these strain rate tensors. However, our analysis unveils a pronounced correlation between the epicenters of earthquakes that occurred in the past 60–120 years and areas forecasted for higher future earthquake rates based on geodetic strain rates. This correlation appears weak and scattered in analyses of even older earthquakes. To corroborate our findings, we select the 2009 L’Aquila earthquake (mw = 6.3) to prove that its apparently marginal viscoelastic relaxation significantly alters the time series of adjacent benchmarks for the following ~ 30–60 years, explaining the high correlation between recent earthquakes and strain rate peaks. Our findings require a methodological shift in interpreting geodetic data for earthquake forecasting, emphasizing the two-component (plate-tectonics-driven stationary long-term deformation, and decadal transient viscoelastic relaxation after an earthquake) nature of crustal stress accumulation recorded in geodetic data. We underscore the potential of geodesy-derived forecasts to provide deeper insights into seismic hazards, stressing the importance of acknowledging the long-term temporal variability inherent in geodetic measurements.
Open Access link (free): https://rdcu.be/dSc9A