69. Bird, P., D. D. Jackson, Y. Y. Kagan, C. Kreemer, and R. S. Stein [2015] GEAR1: a Global Earthquake Activity Rate model constructed from geodetic strain rates and smoothed seismicity, Bull. Seismol. Soc. Am., 105(5); 2538-2554, doi: 10.1785/0120150058.
Abstract. GEAR1 estimates the rate of shallow earthquakes with magnitudes 6 through 9 everywhere on Earth. It was designed to be reproducible and testable. Our preferred hybrid forecast is a log-linear blend of two parent forecasts based on the Global CMT catalog (smoothing 4602 m ≥ 5.767 shallow earthquakes, 1977-2004) and the Global Strain Rate Map version 2.1 (smoothing 22415 GPS velocities), optimized to best forecast the 2005-2012 GCMT catalog. Strain rate is a proxy for fault stress accumulation, and earthquakes indicate stress release, so a multiplicative blend is desirable, capturing the strengths of both approaches. This preferred hybrid forecast outperforms its seismicity and strain rate parents; the chance that this improvement stems from random seismicity fluctuations is less than 1%. The preferred hybrid is also tested against the independent parts of the ISC-GEM catalog (m ≥ 6.8 during 1918-1976) with similar success. GEAR1 is an update of this preferred hybrid. Comparing GEAR1 to the Uniform California Earthquake Rupture Forecast version 3 (UCERF3), net earthquake rates agree within 4% at m ≥ 5.8 and at m ≥ 7.0. The spatial distribution of UCERF3 epicentroids most resembles GEAR1 after UCERF3 is smoothed with a 30-km kernel. As UCERF3 has been constructed to derive useful information from fault geometry, slip rates, paleoseismic data, and enhanced seismic catalogs (not used in our model), this is encouraging. To build parametric catastrophe bonds from GEAR1, one could calculate the magnitude for which there is a 1% (or any) annual probability of occurrence in local regions.
Files and instructions for computing the forecast
 .
.
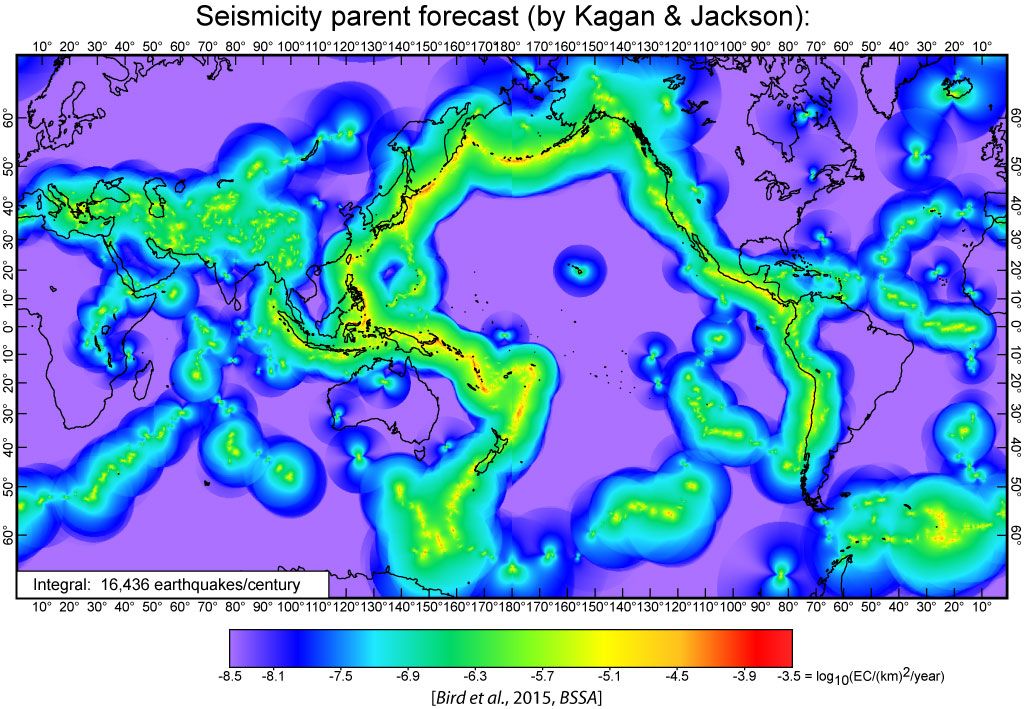
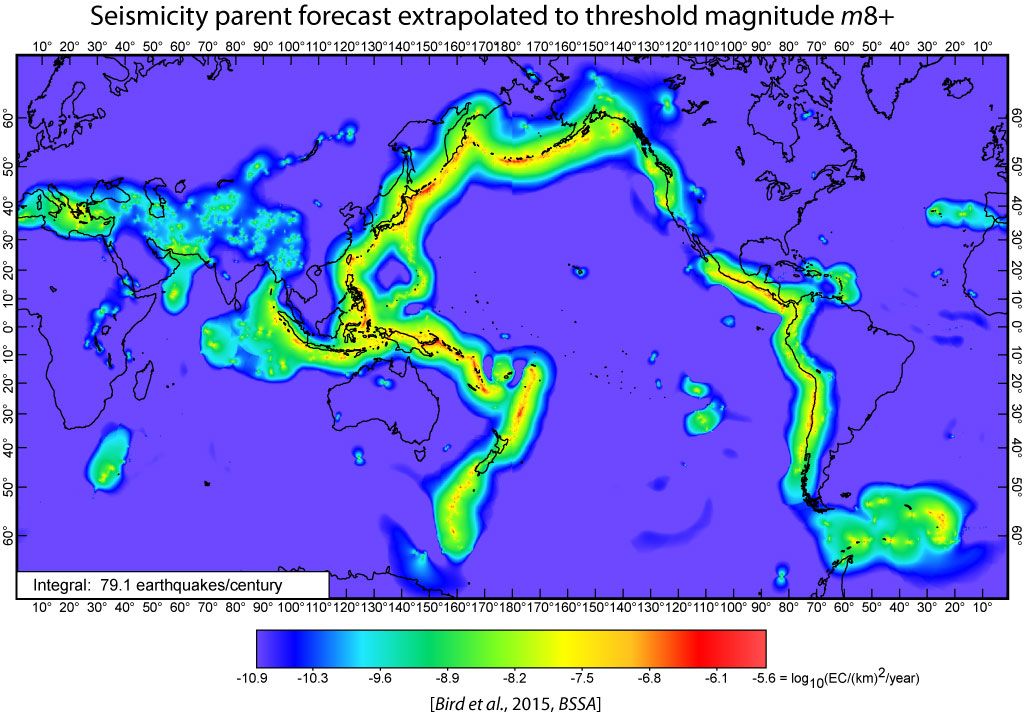
Figure 1A. Seismicity parent forecast with threshold magnitude m5.767+ for years 2005+. Mercator projection. Logarithmic color-scale shows the rate density of epicentroids corresponding to shallow (≤70 km) hypocentroids, in units of (km)-2 year-1.
 .
.
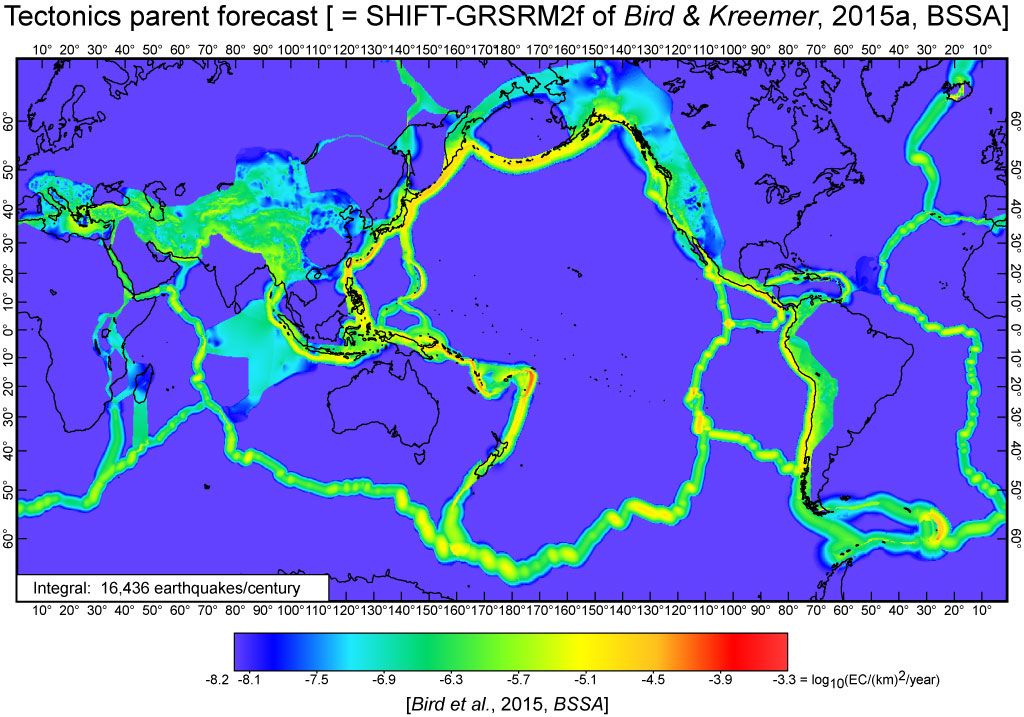
Figure 1B. Tectonics parent forecast with threshold magnitude m5.767+ for years 2005+. Mercator projection. Logarithmic color-scale shows the rate density of epicentroids corresponding to shallow (≤70 km) hypocentroids, in units of (km)-2 year-1. Identical color-scale to that of Figure 1A above. This forecast is equal to model SHIFT-GSRM2f of #68: Bird and Kreemer [2015], except that its original spatial grid of 0.25 × 0.20-degree cells is here resampled to a finer 0.1 × 0.1-degree grid.
 .
.
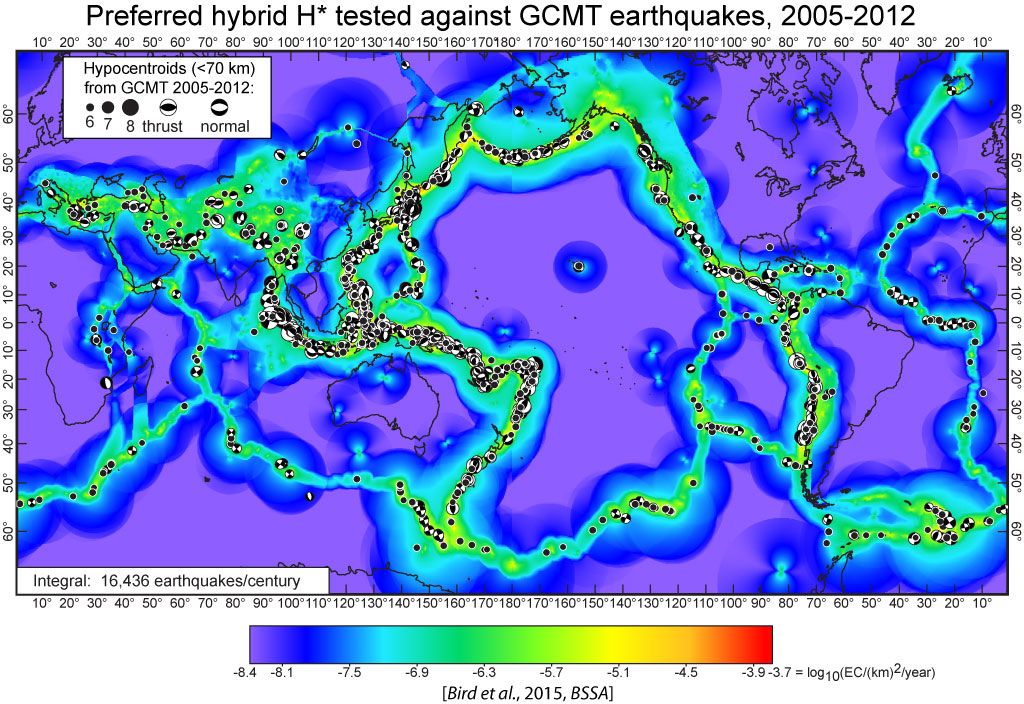
Figure 2A. Preferred hybrid forecast for threshold magnitude m5.767+, with overlay of test earthquakes: Preferred hybrid forecast H* (log-linear, with exponent d = 0.6 on Seismicity) for years 2005+ compared to 1694 shallow test earthquakes from GCMT catalog years 2005-2012. For test earthquakes of m > 6, focal mechanism is shown on lower focal hemisphere. Scores from this comparison (and many others) are shown in Table S1 (available through the manuscript link above) and Figure 3. Mercator projection. Logarithmic color-scale shows the rate density of epicentroids corresponding to shallow (≤70 km) hypocentroids, in units of (km)-2 year-1.
 .
.
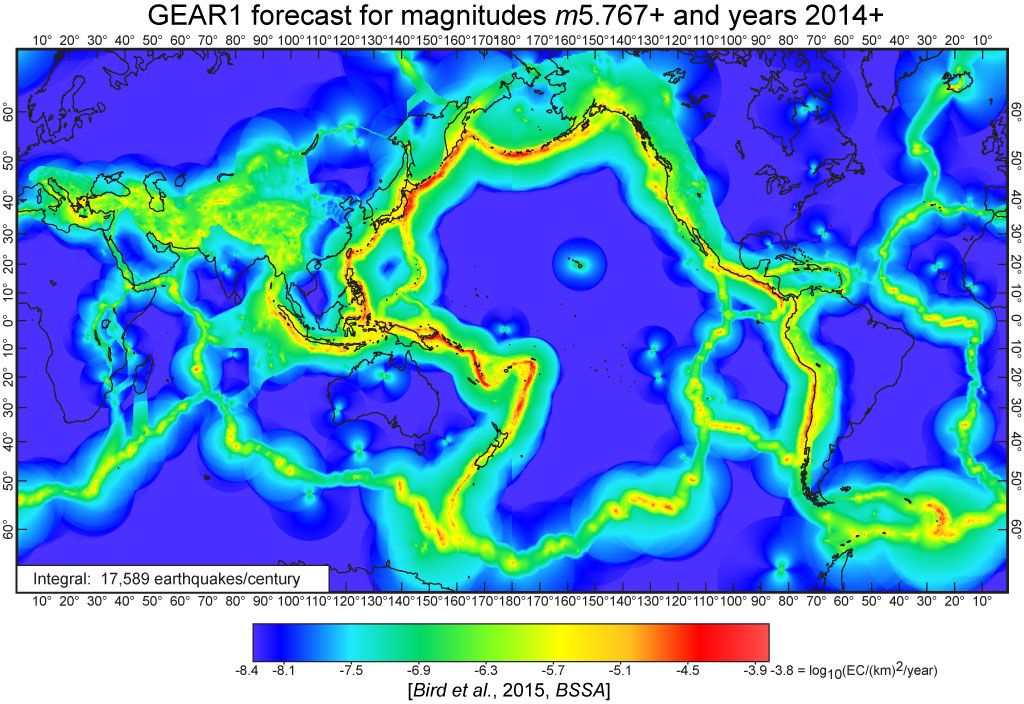
Figure 2B. Preferred hybrid forecast for threshold magnitude m5.767+, without overlay of any test earthquakes: GEAR1 forecast (preferred hybrid H*, updated to end-2013) for years 2014 and after. Mercator projection. Logarithmic color-scale shows the rate density of epicentroids corresponding to shallow (≤70 km) hypocentroids, in units of (km)-2 year-1.
 .
.
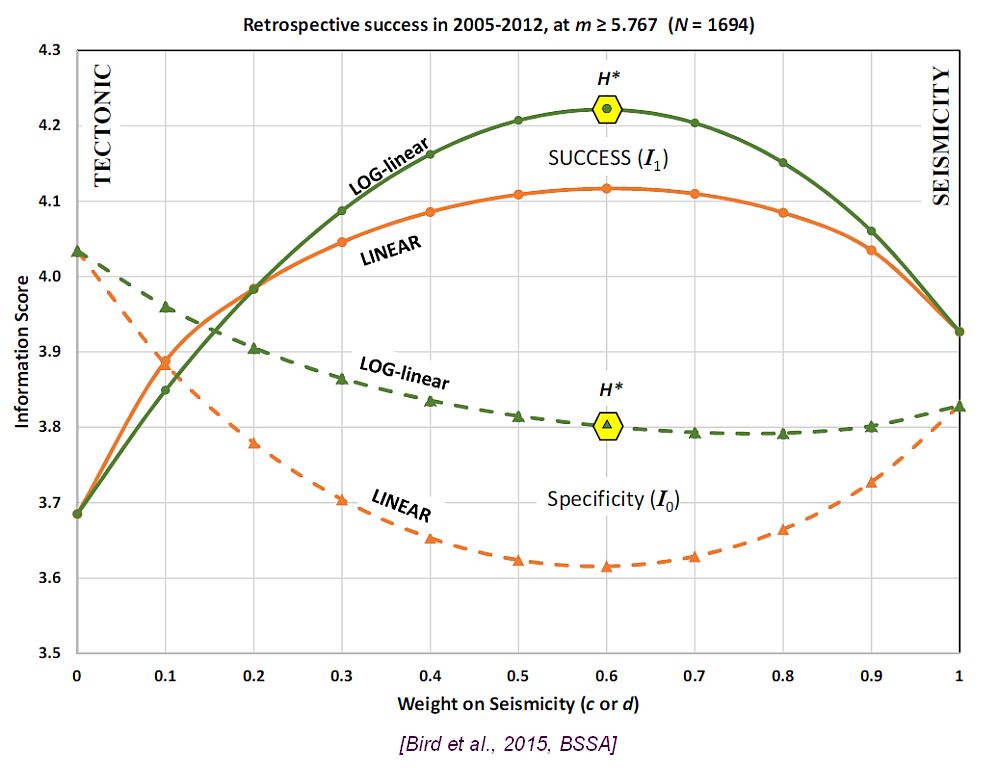
Figure 3. Success I1 and specificity I0 of both linear and log-linear hybrid models as a function of mixing parameter c or d, in tests against GCMT catalog years 2005-2012 at threshold m5.767+. Both of these I information scores were defined by Kagan [2009]. The preferred hybrid model H* is highlighted.
 .
.
Figure 4. Small-sample standard deviations (diamonds) of the success of the Tectonics forecast, σ(I1(T)), as a function of test window length W, in the range of 1 to 9 years. Based on multiple subdivisions (with re-use) of GCMT catalog years 1977-2012. Dashed line with slope -1/2 appears consistent with these bootstrap experimental results. There are 2 points at W = 2 years, 3 points at W = 3 years, etc., because these longer windows can be defined using W different start-years. The number of scores compared to compute each sample standard deviation decreases, with increasing W, from 36 to 3~4, which explains the increasing scatter of these sample standard deviations.
 .
.
Figure 5. Extrapolation of the Seismicity parent forecast (from Figure 1A, for years 2005+) to threshold m8+. Epicentroid rate density of each cell was extrapolated with the tapered Gutenberg-Richter frequency/magnitude distribution (8) using corner magnitudes and spectral slopes based on Table 1 of Kagan et al. [2010] and the tectonic zone map of the same paper, but only after edits and smoothing had been applied to the maps of corner magnitude and spectral slope, as described in text. Most spreading ridges have disappeared from this map because their corner magnitudes are less than the m8+ threshold. A few active spots remain where oceanic transform slip is transpressive; because slip-partitioning into thrust earthquakes is expected, these regions were assigned to tectonic zone 4 by Kagan et al. [2010].
 .
.
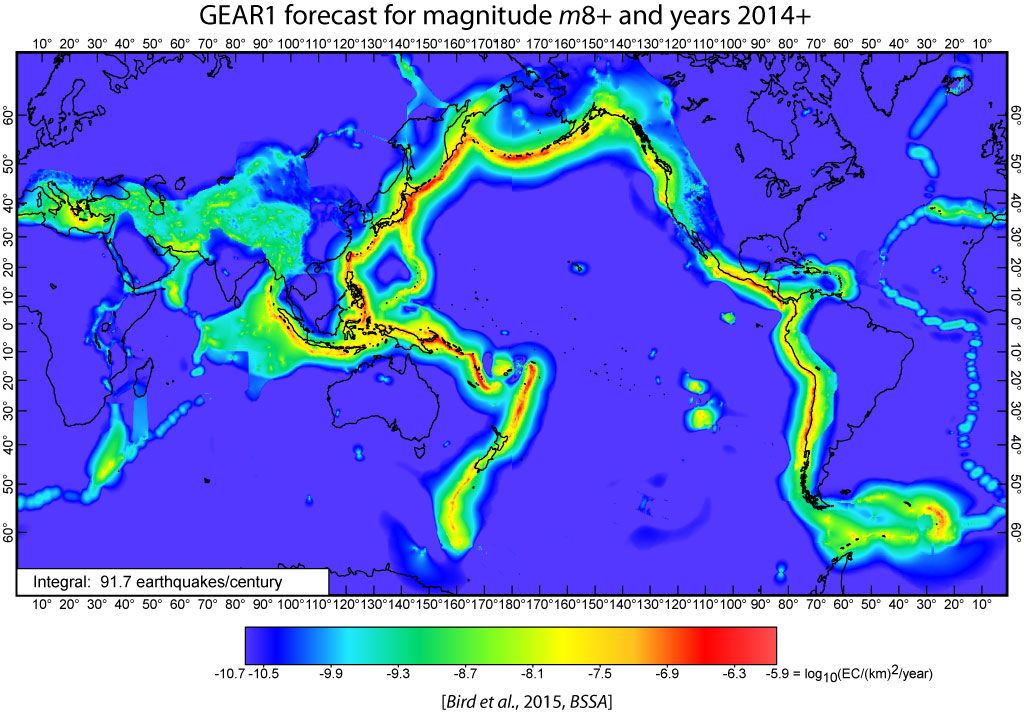
Figure 6. GEAR1 forecast for threshold magnitude m8+ and for years 2014 and after. Conventions as in Figure 2B. Global earthquake rate is based on equation (9). This map has strong similarities to the parent Seismicity forecast of Figure 5, but also reflects the influence of the Tectonics parent forecast in its better depiction and resolution of plate boundary zones, and also the updating of both parent forecasts to the end of 2013.
 .
.
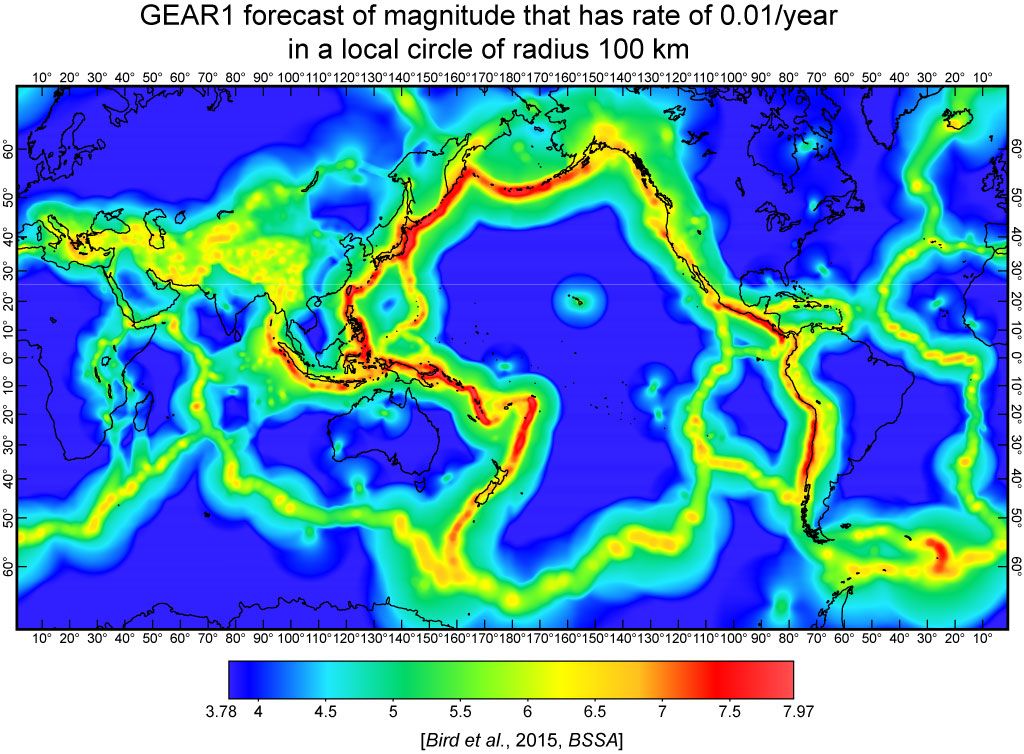
Figure 7. GEAR1 forecast for years 2014 and after, represented as the magnitude that has forecast epicentroid rate of 0.01/year (i.e., probability of approximately 1% per year) within a local circle of radius 100 km about each test point.
 .
.
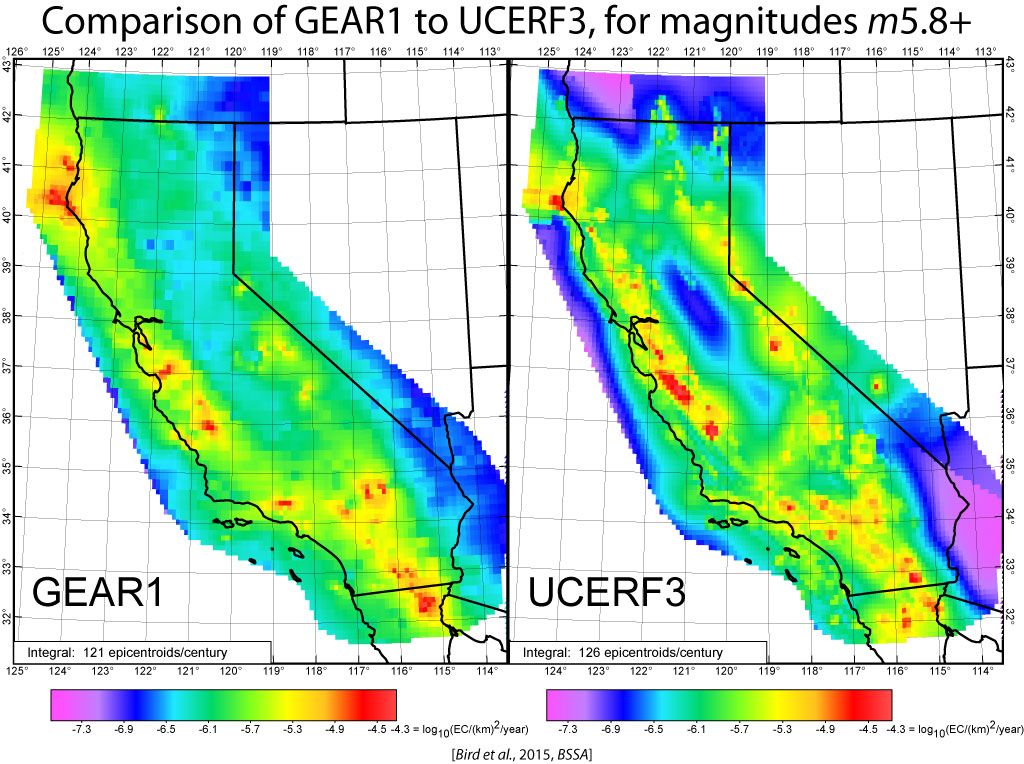
Figure 8. Comparison of: (a) GEAR1 long-term epicentroid rate densities in the California region at threshold magnitude m5.8+, with: (b) the branch-weighted mean time-independent seismicity forecast UCERF3 by Field et al. [2013] at the same threshold. The GEAR1 forecast has been windowed to match the area covered by UCERF3. Note that the UCERF3 forecast has not been smoothed for this figure, although smoothing is discussed in the text. Statistics of the comparison are presented in the text.
P.S. Prospective global testing of GEAR1 became possible 2014.01.01 because the model used no earthquakes or other data after that date. My own (informal) test results will be posted here, and updated in May~June of each year:
Prospective I1 (“success”) scores
[per Kagan, 2009, GJI]
in mean binary bits of information gain per shallow m ≥ 5.767 earthquake,
relative to a reference model of globally-uniform shallow seismicity,
when tested against the shallow part of the GCMT catalog:
|
Long-term forecast model: |
2014 |
2015 |
2016 |
2017 |
2018 |
2019 |
2020 |
2021 |
2022 |
2023 |
|
GEAR1 [Bird et al., 2015, BSSA] |
4.3287 |
4.7270 |
4.4597 |
3.8844 |
4.1067 |
4.6835 |
4.0770 |
4.4738 |
4.4300 |
4.2886 |
|
Smoothed-seismicity (Kagan, p.c., mid-2014) |
4.1163 |
4.4688 |
4.1911 |
3.6807 |
4.0571 |
4.6710 |
3.8161 |
4.2397 |
4.2107 |
4.1572 |
|
SHIFT_GSRM2f [Bird & Kreemer, 2015, BSSA] |
3.7043 |
4.1795 |
3.9251 |
3.2457 |
3.2354 |
3.7422 |
3.5214 |
3.8715 |
3.8367 |
3.5375 |
|
SHIFT_GSRM [Bird et al., 2010, BSSA] |
3.6666 |
4.1188 |
3.8074 |
3.2540 |
3.2309 |
3.8281 |
3.4763 |
3.7266 |
3.7675 |
3.4829 |
Note that the first 3 years of prospective scores (2014, 2015, 2016) from the table above have now been peer-reviewed and published in paper #78: Bird [2018, Seismol. Res. Lett.].
Formal, independent test results can be obtained from the website of CSEP (Collaboratory for the Study of Earthquake Predictability) at http://cseptesting.org . Select: Results / SCEC Testing Center / Region = global / Forecast group = one-year models v15.10 / Model = GEAR1.
In
particular, the first 2 years of independent prospective scoring with CSEP
algorithms is reported in:
Strader, A., M. Werner, J. Bayona, and D. Schorlemmer [2018] Prospective
evaluation of global earthquake forecast models: Two years of observations
support merging smoothed seismicity with geodetic strain rates, Seismol.
Res. Lett., 89(4), 1262-1271, doi: 10.1785/0220180051.
Also,
an interesting comparison of GEAR1 performance to that of 3 national/regional
models was published as:
Bayona, J. A., W. H. Savran, P. Iturrieta, M. C. Gerstenberger, K. M.
Graham, W. Marzocchi, D. Schorlemmer, and M. J. Werner [2023]
Are Regionally Calibrated Seismicity Models More Informative than Global
Models? Insights from California, New Zealand, and Italy,
The Seismic Record, 3(2), 86–95, doi: 10.1785/0320230006.