78. Bird, P. [2018] Ranking some global forecasts with the Kagan information score, Seismol. Res. Lett., 89(4), 1272-1276, doi: 10.1785/0220180029.
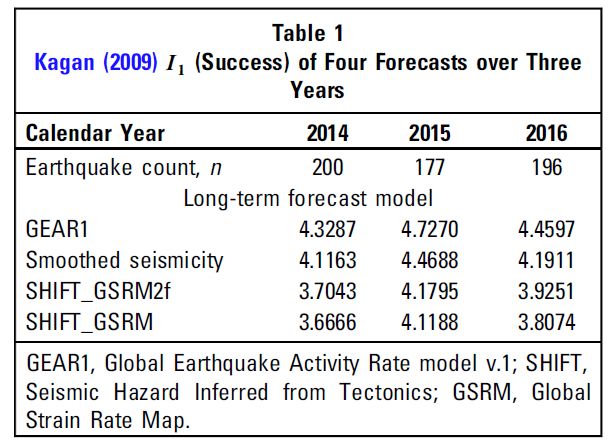
Abstract. The Kagan [2009] information score I1 is a simple metric for the relative success of the map patterns of any seismicity forecasts with the same spatial extent and the same earthquake-selection rules. Because it does not require declustering of either the forecast or the test catalog, it is particularly appropriate for forecasts of total seismicity. Three years of prospective testing have given consistent rankings of four global models of shallow seismicity, demonstrating the expected superiority of the Global Earthquake Activity Rate model v.1 (GEAR1) hybrid forecast relative to its smoothed seismicity and tectonic parent forecasts. Accumulation of I1 scores and their covariances over a number of consecutive test periods naturally leads to estimated significance of each ranking, so continuing testing is desirable.
P.S. For a full explanation of these models (especially GEAR1), see my paper #69 Bird et al. [2015, BSSA].
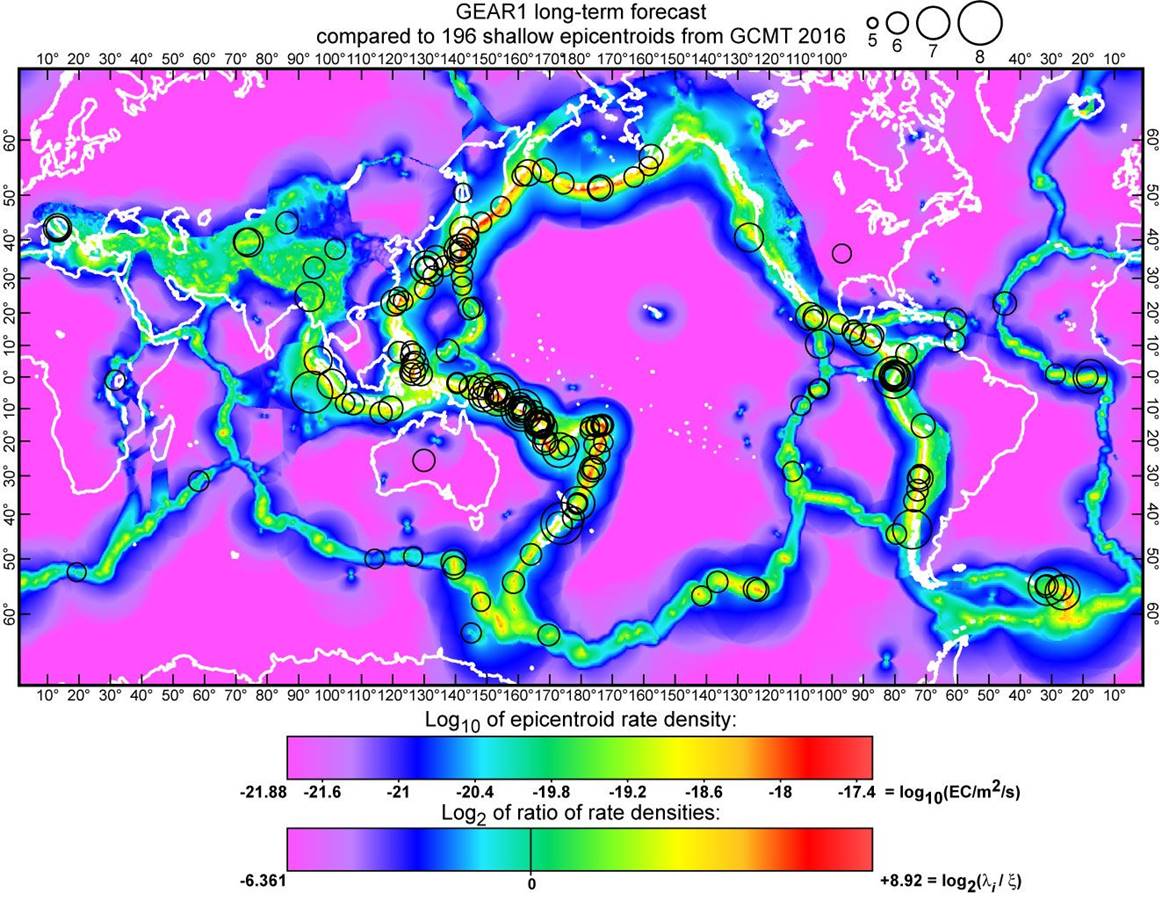
Figure 1. Example of I1 scoring of long-term forecast Global Earthquake Activity Rate model v.1 (GEAR1) in the year 2016. Epicentroid rate densities (top color bar) are converted to base-2 logarithms of the dimensionless ratio of rate densities (see equation 1). This value (bottom color bar), sampled at the test earthquake epicentroid, is its contribution to the I1 score; the final score is obtained by averaging over all 196 test earthquakes. CMT, Centroid Moment Tensor.
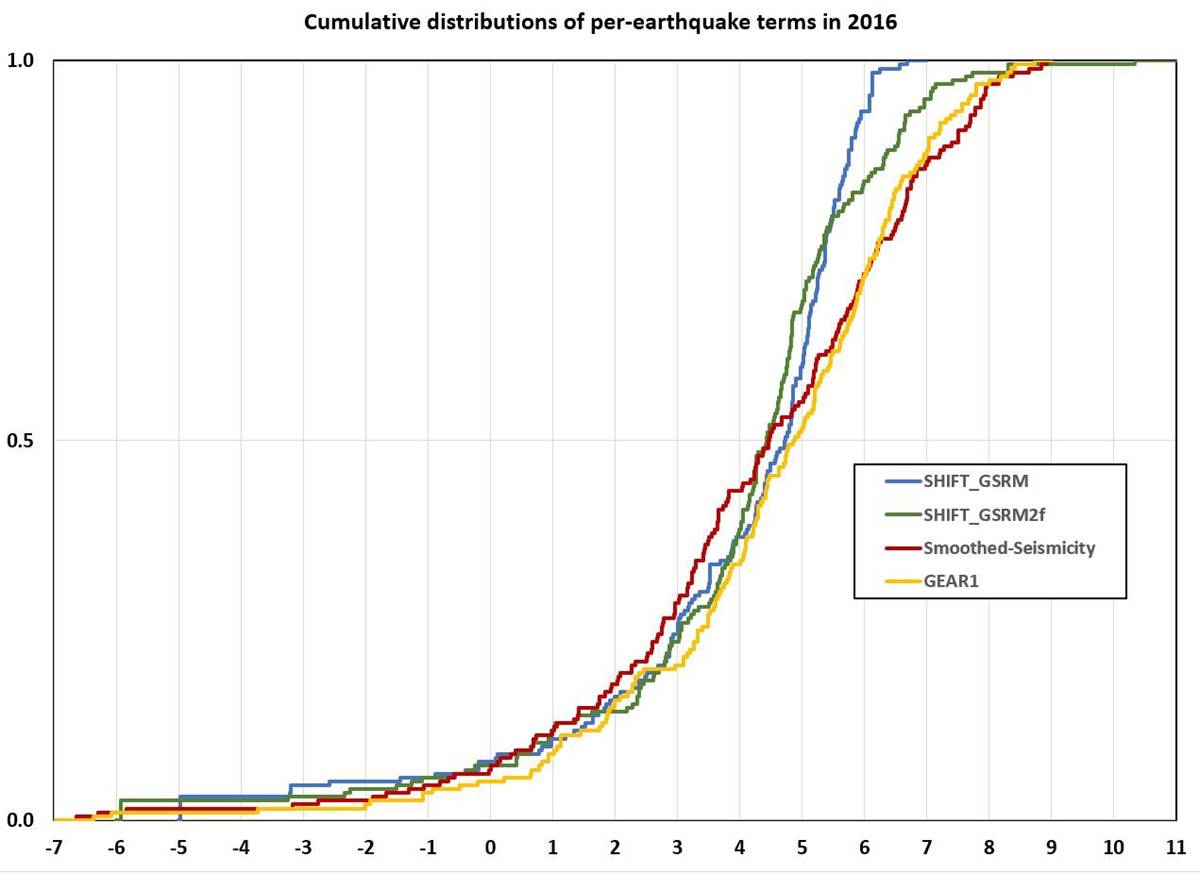
Figure 2. Cumulative distribution functions (CDFs) of per-earthquake contributions to I1 (equation 1; here referred to as x), before averaging, for each of the four global models in 2016. Each CDF has 196 steps, for the 196 test earthquakes in that year. Better performance is indicated by a CDF curve which is further to the right. This graph shows that, in 2016, GEAR1 outperformed the other models along most parts of the curve, with two exceptions: SHIFT_GSRM2f was better in one low-seismicity region (1.9 < x < 2.7), and smoothed seismicity was better in the highest-seismicity regions (x > 6.3). Abbreviations: SHIFT, Seismic Hazard Inferred from Tectonics; GSRM, Global Strain Rate Map.