89. Bird, P., J. B. May, and M. M. C. Carafa [2026] Fault friction, plate rheology, and mantle torques from a global dynamic model of neotectonics, J. Geophys. Res.: Solid Earth, 131, e2025JB032949, https://doi.org/10.1029/2025JB032949 [Open Access].
ABSTRACT:
Improvements in software, parallel computing, global datasets, and laboratory flow-laws help to develop the global Earth5 thin-shell finite-element model of Bird et al. [2008, doi:10.1029/2007JB005460, referred to here as Paper I] into a benchmark study. All experiments confirm that modeled faults (other than megathrusts) have low effective friction of 0.085±0.034. The average down-dip integral of shear traction on subduction megathrusts is 1.3±0.2×10¹² N/m. In plate interiors the dislocation-creep flow-law for continental crust is about twice as strong as granodiorite; close to diorite. Upper-mantle creep strength is close to olivine-rich peridotite in both oceanic lithosphere and continents. “Byerlee’s law” friction of 0.85 applies between active faults in both oceanic lithosphere and stable continents. Computed net slab-pull on subducting plates is typically comparable to ridge-push, but ranges to 5× larger; slab-pull moves the plate toward the trench (6 cases) or is neutral (1 case). Under the 6 largest plates with no attached slabs, basal tractions are 0.1~1.2 MPa. Implications for Earth mechanics include: (1) Plate-boundary faults are weakened by low-friction minerals in oceanic transform faults, temporary coseismic pore pressure elevation in many continental transforms, and permanent high pore pressure in subduction megathrusts; (2) Such weak faults are rare in plate interiors, which display Byerlee’s Law friction and dislocation creep strengths matching laboratory results; (3) Generally “forward” net slab pull and basal shear tractions help gravitational potential energy to drive the plates. Implications for future modeling include: (4) Fault elements are required; (5) Laboratory flow-laws should replace Newtonian viscosity; and (6) Mohr-Anderson friction should replace isotropic plasticity.
SUPPORTING INFORMATION (3 MB PDF file) contains 3 additional text and 16 additional figures.
P.S.
The preferred model from this study (Earth5-271) updates and replaces the
preferred model of Bird
et al. [2008]. However, the infrastructure in that earlier paper (e.g.,
definitions, derivations, and error analysis) is an essential basis for this
study.
To access the source codes and data files used to create this new preferred
model, see section “OPEN RESEARCH” at the end of this 2026 paper.
OVERVIEW of Preferred Model Earth5-271:
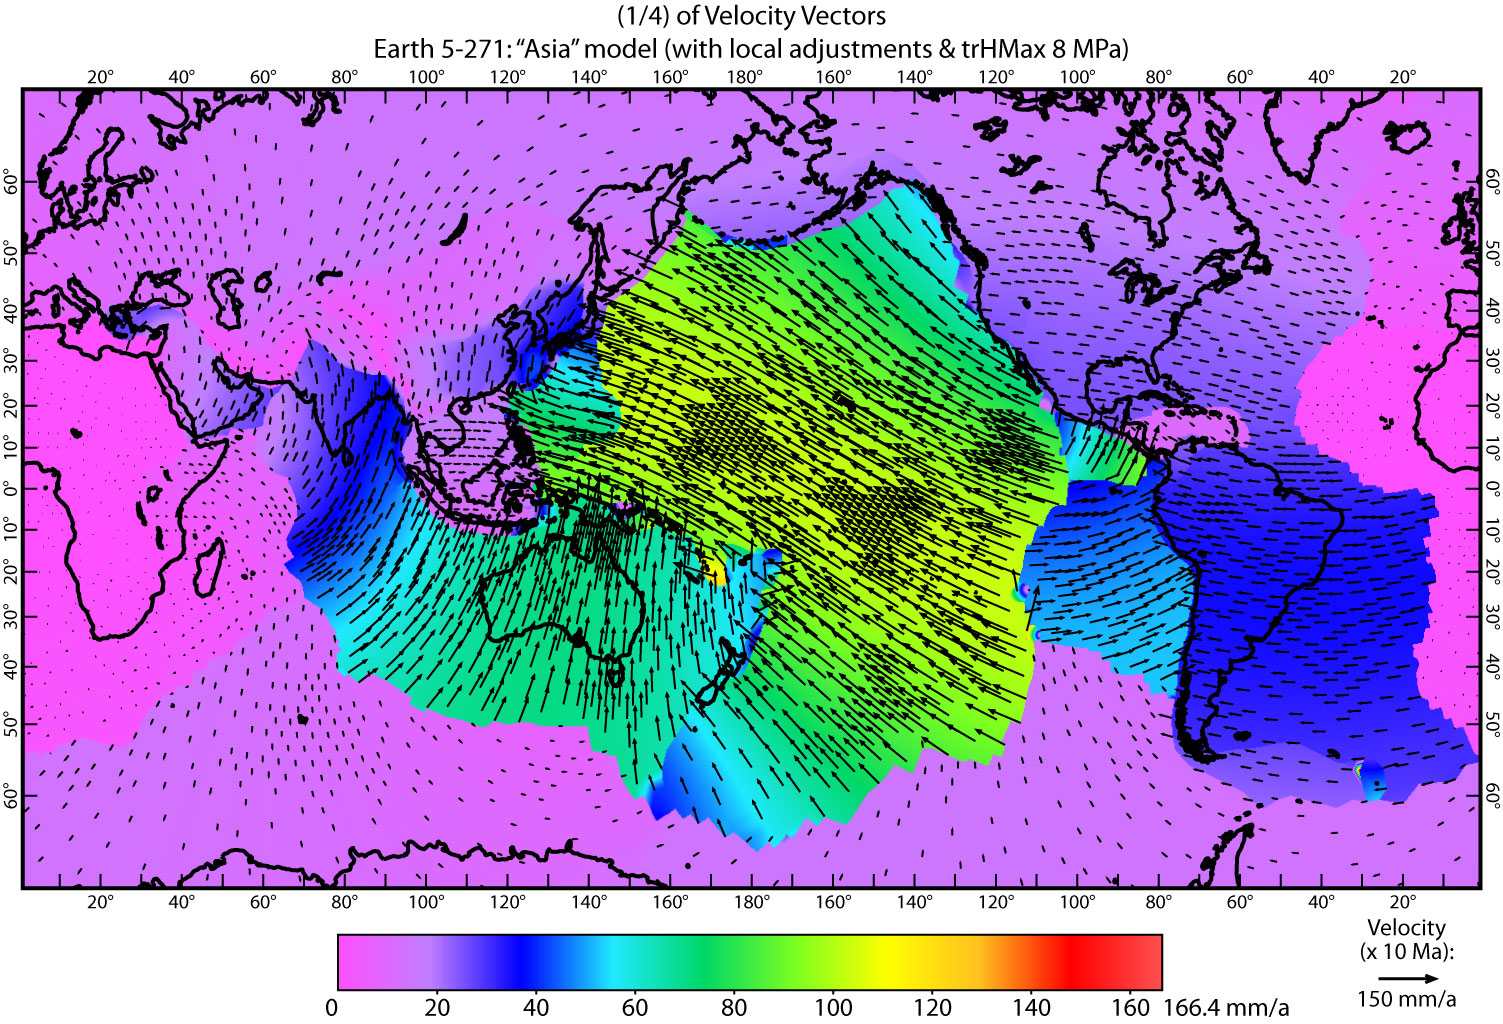
Figure 1. Horizontal velocities in preferred model Earth5-271 “Asia”. For clarity, vectors are only plotted at ¼ of nodes. Mercator projection.
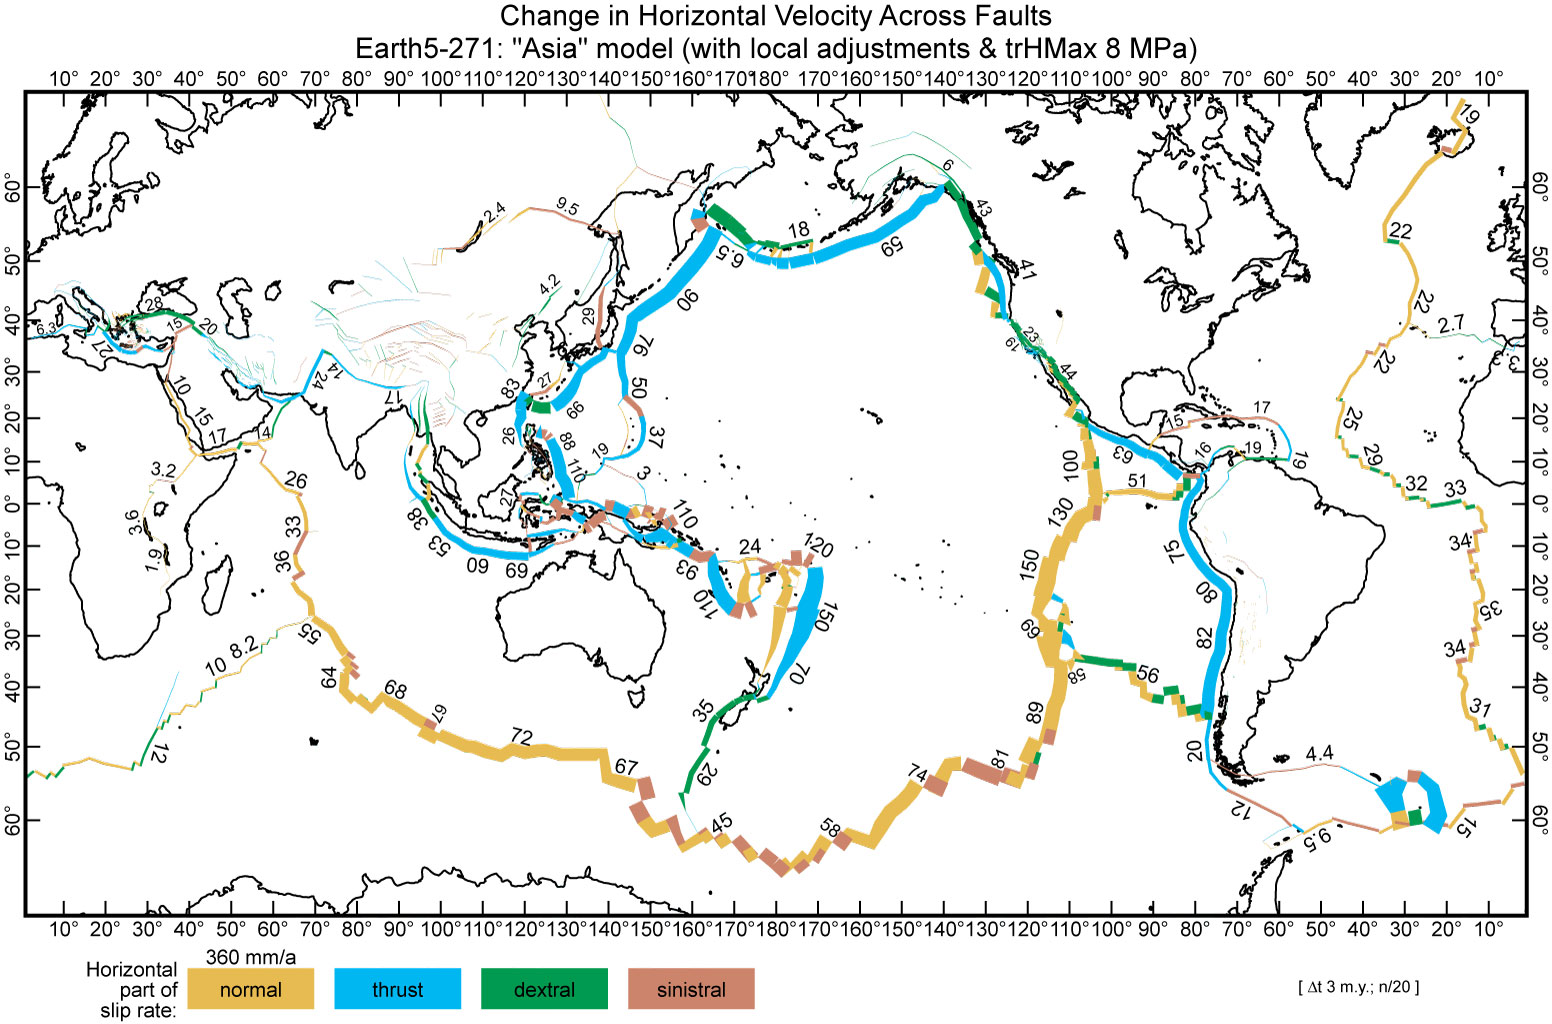
Figure 2. Fault heave rates (discontinuities in vector horizontal velocities) in preferred model Earth5-271 “Asia”. Compare with this unpublished figure from the rigid-plate/orogens model of PB2002 of Bird (2003).
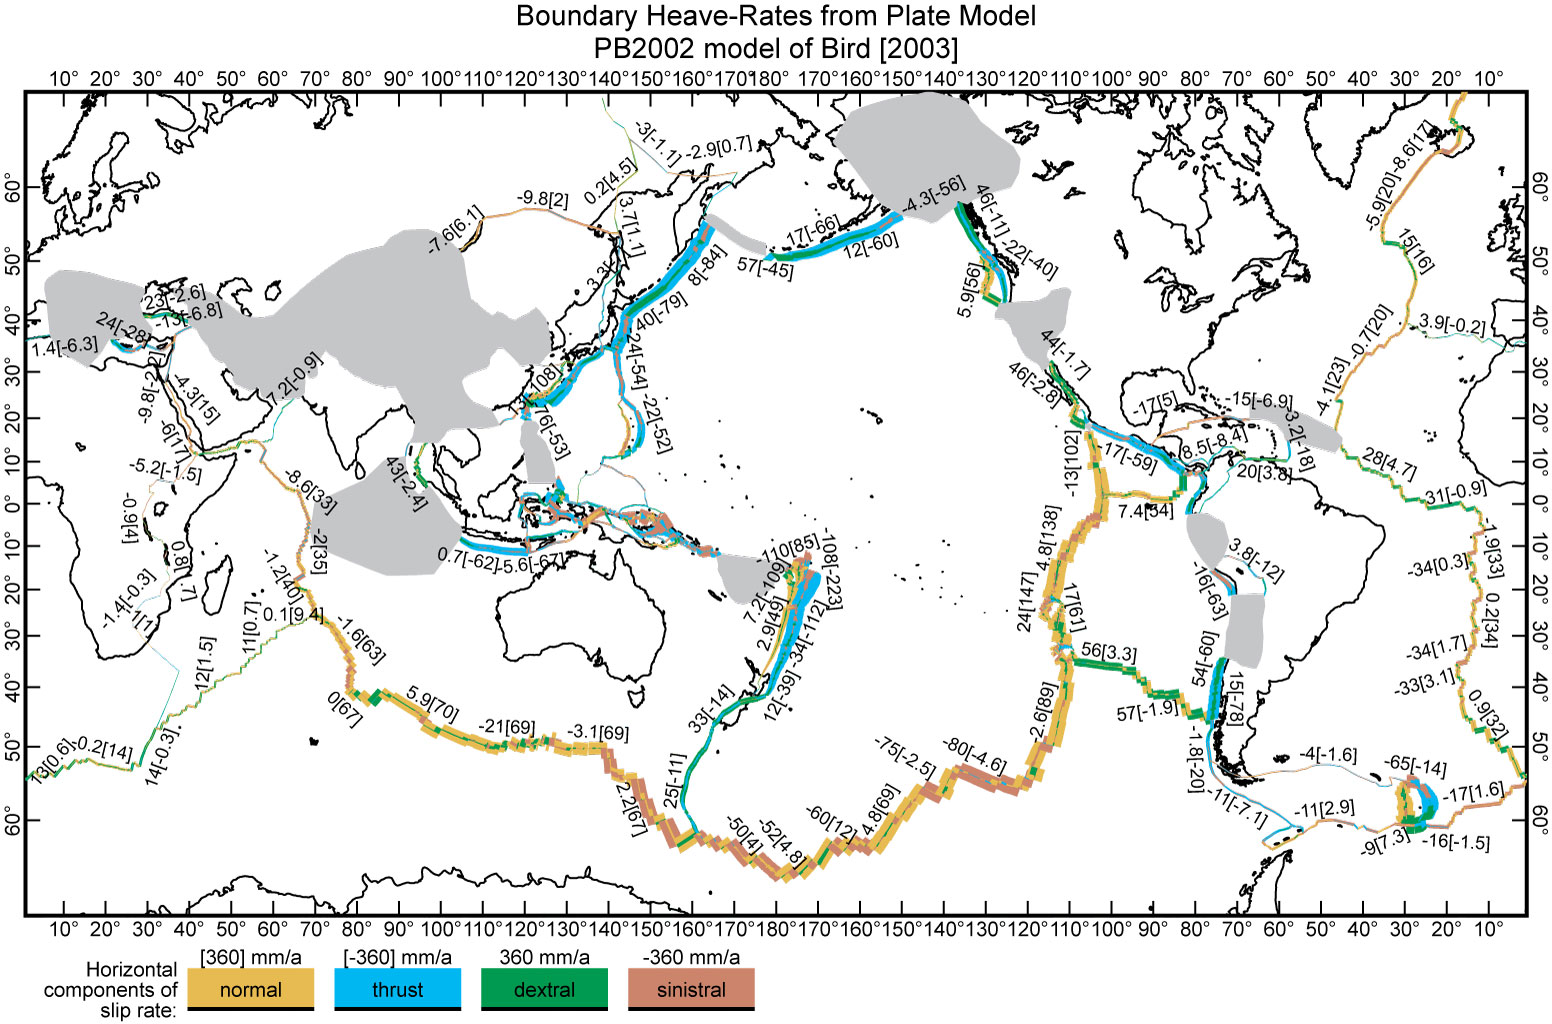
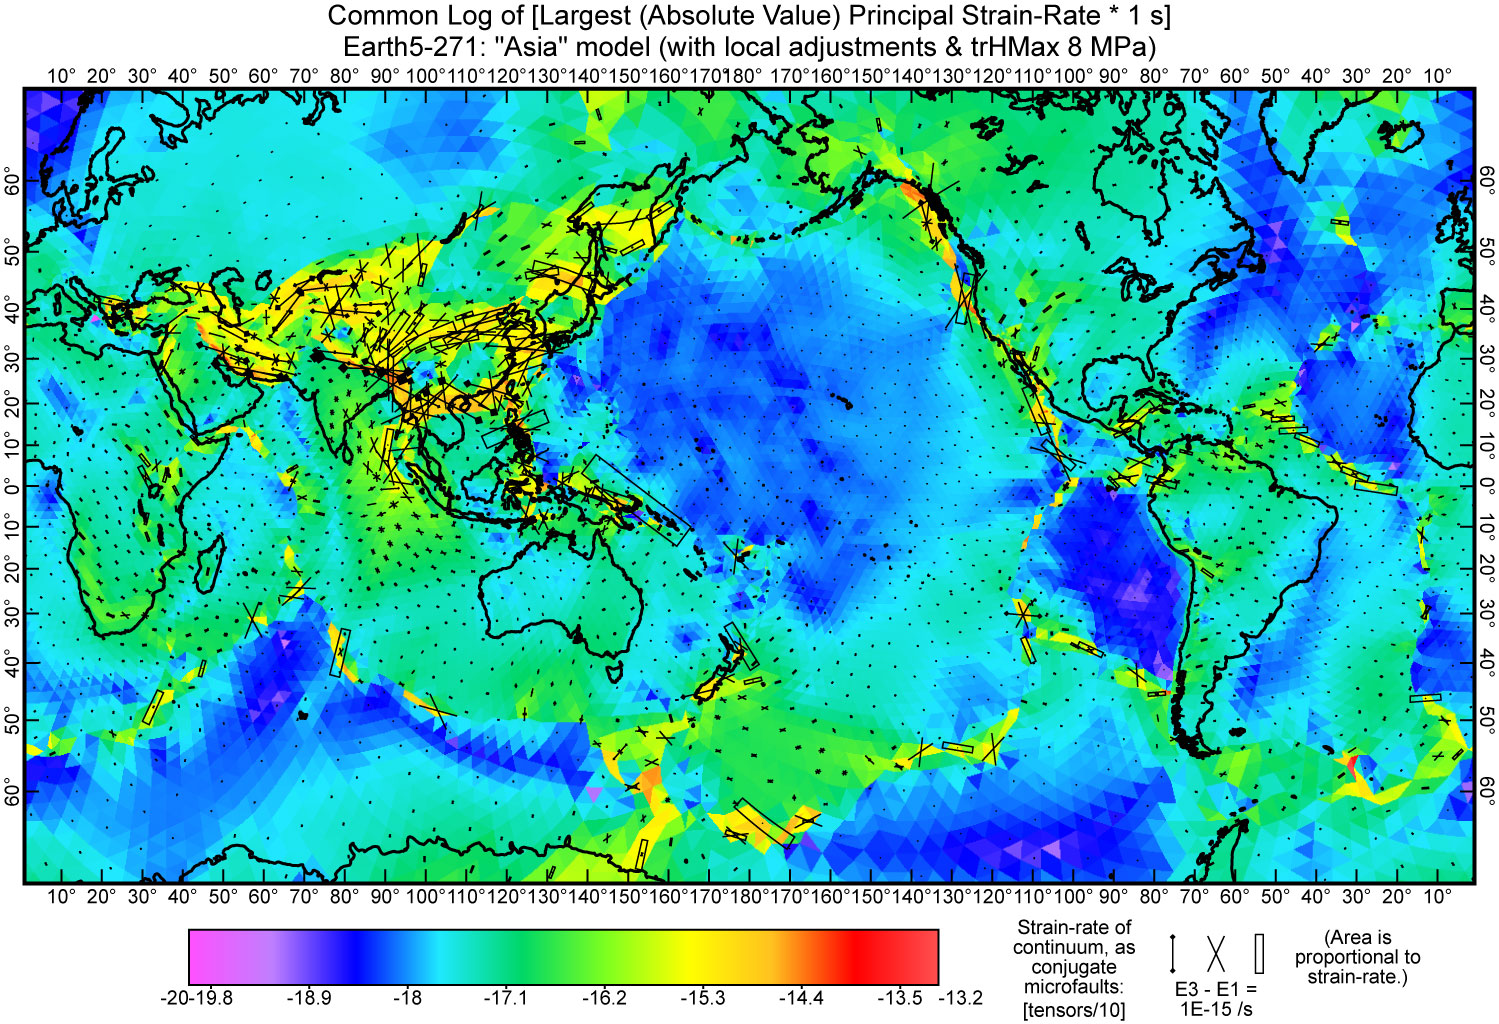
Figure 3. Strain-rates in continuum between modeled faults in preferred model Earth5-271 “Asia”. Strain-rates are represented both in scalar form (in color) and with selected tensor symbols showing the predicted types of neotectonic faulting. (“X” indicates strike-slip on conjugate faults; a dumbbell shows the common strike of conjugate thrust faults; and rectangles suggest grabens formed by conjugate normal faulting.) Note that all values on this map distinguish this dynamic model from the plate model PB2002 of Bird (2003), because in a plate model all continuum strain-rates are zero (except in designated orogens).
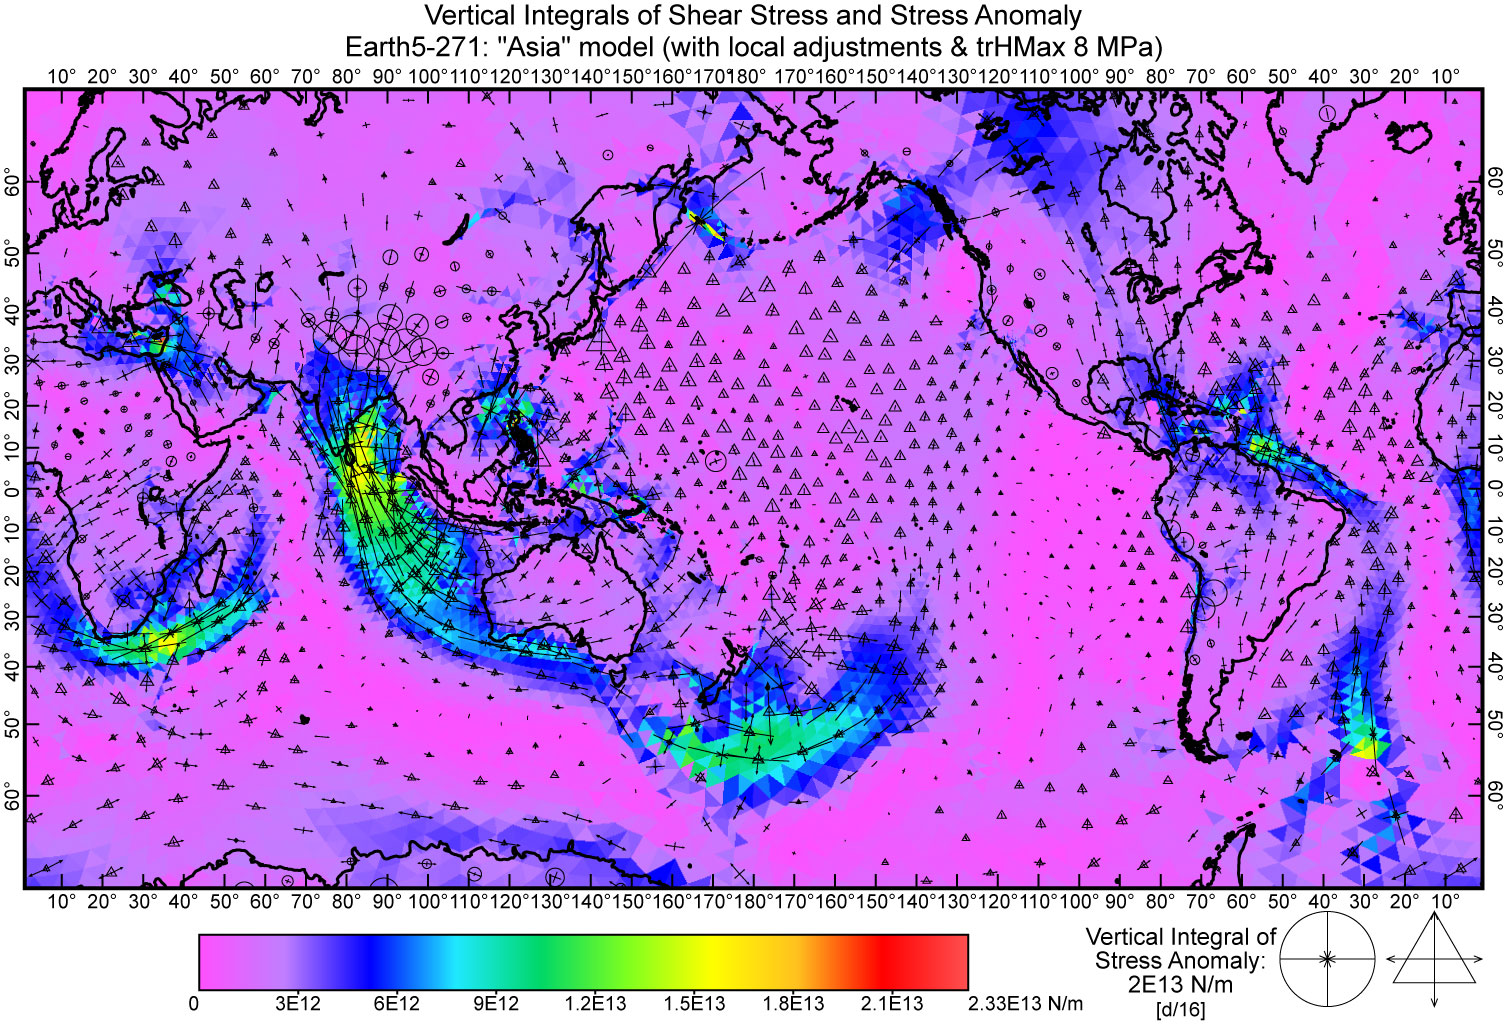
Figure 4. Vertically-integrated shear stresses (colors) and stress anomalies (selected tensors) from preferred model Earth5-271 “Asia”. Vertical integration is through the model lithosphere. See Paper I for definition of stress anomaly tensor. In these tensor symbols, a circle indicates vertical compression (e.g., in Tibet) while a triangle indicates vertical tension.
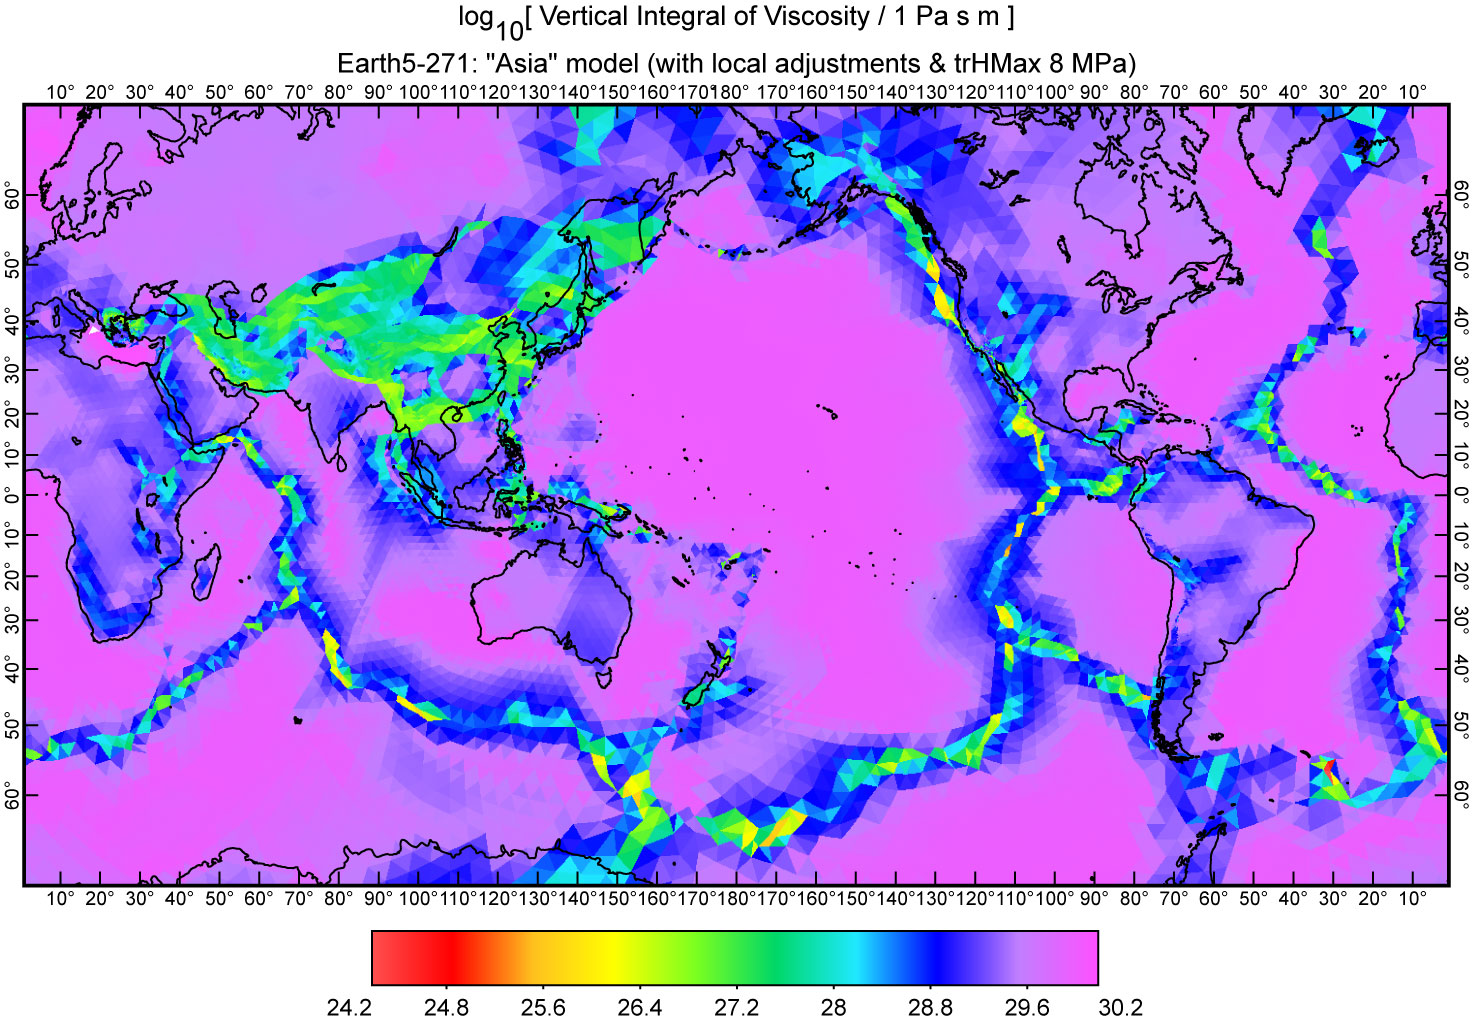
Figure S15. Vertical integrals (through the lithosphere) of effective viscosity for preferred model Earth5-271 “Asia”. A logarithmic color scale is used to represent the extreme range of 6 orders of magnitude. Although ShellSet models use nonlinear flow-laws of frictional plasticity and dislocation-creep, effective viscosity can always be computed as one-half the ratio of deviatoric stress to deviatoric strain-rate at each depth-collocation point in each finite element. Those values are then vertically-integrated for this plot. In practice, effective viscosity tends to decrease with increasing strain-rate and/or heat-flow.
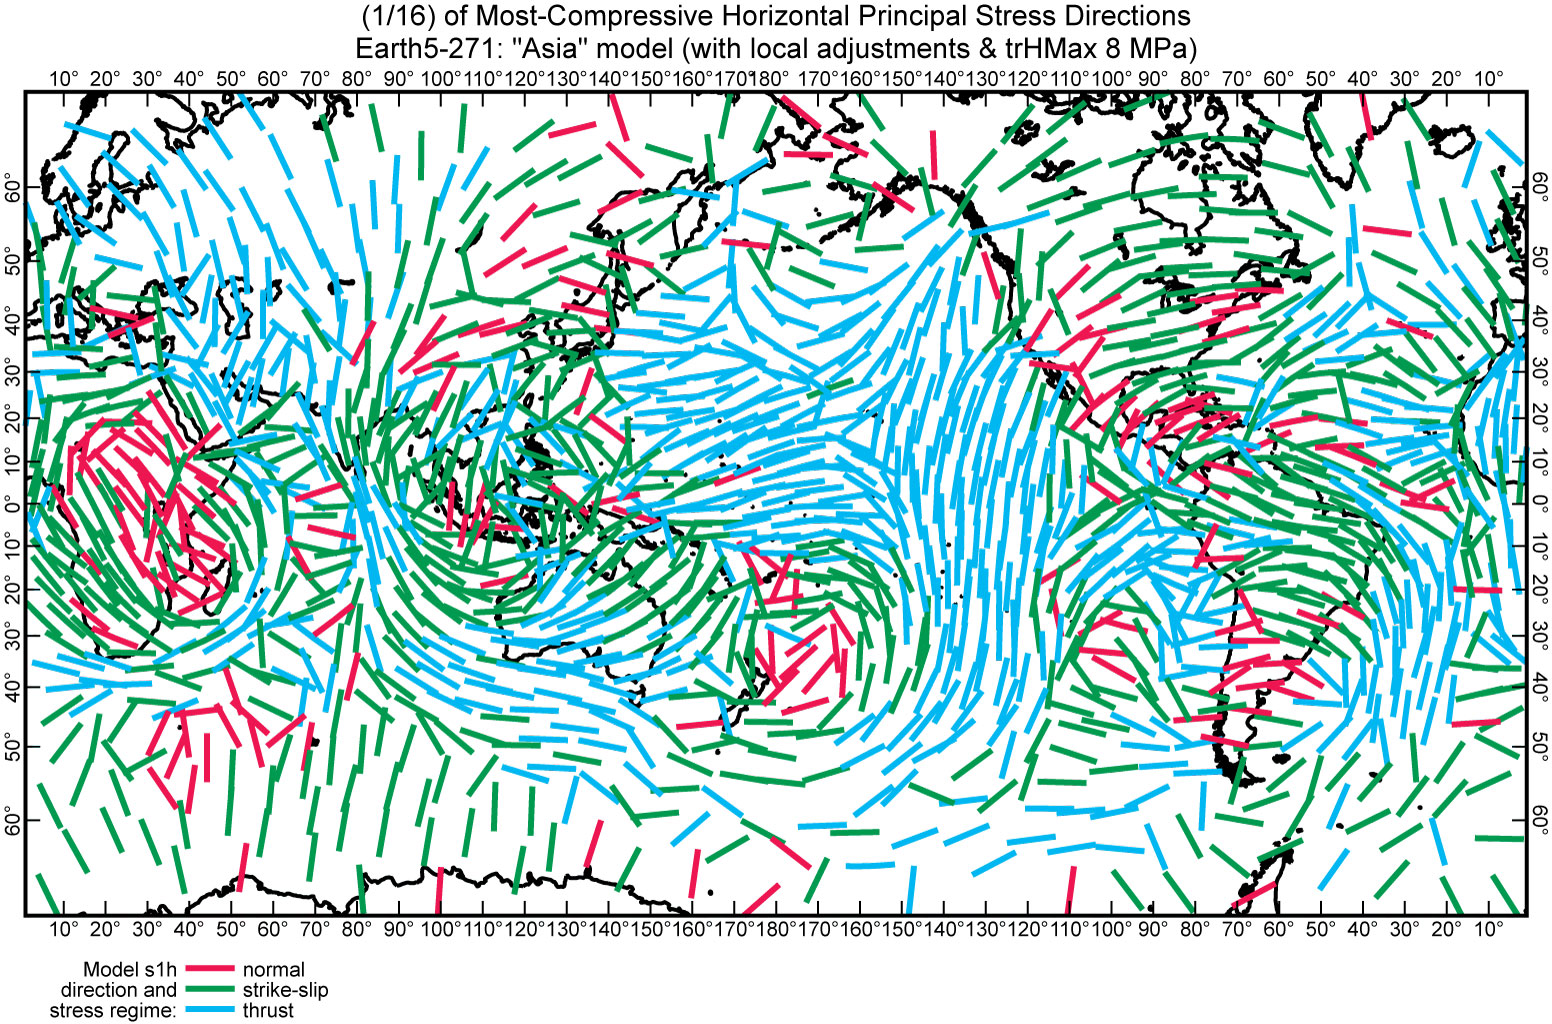
Figure S16. Azimuths of most-compressive horizontal principal stress (parallel to most-compressive horizontal principal strain-rate in isotropic continua) from preferred model Earth5-271 “Asia”. Tectonic regime is indicated by symbol color. Azimuths in this figure can be compared to those of scoring dataset SD in Figure S3 in Supporting Information.
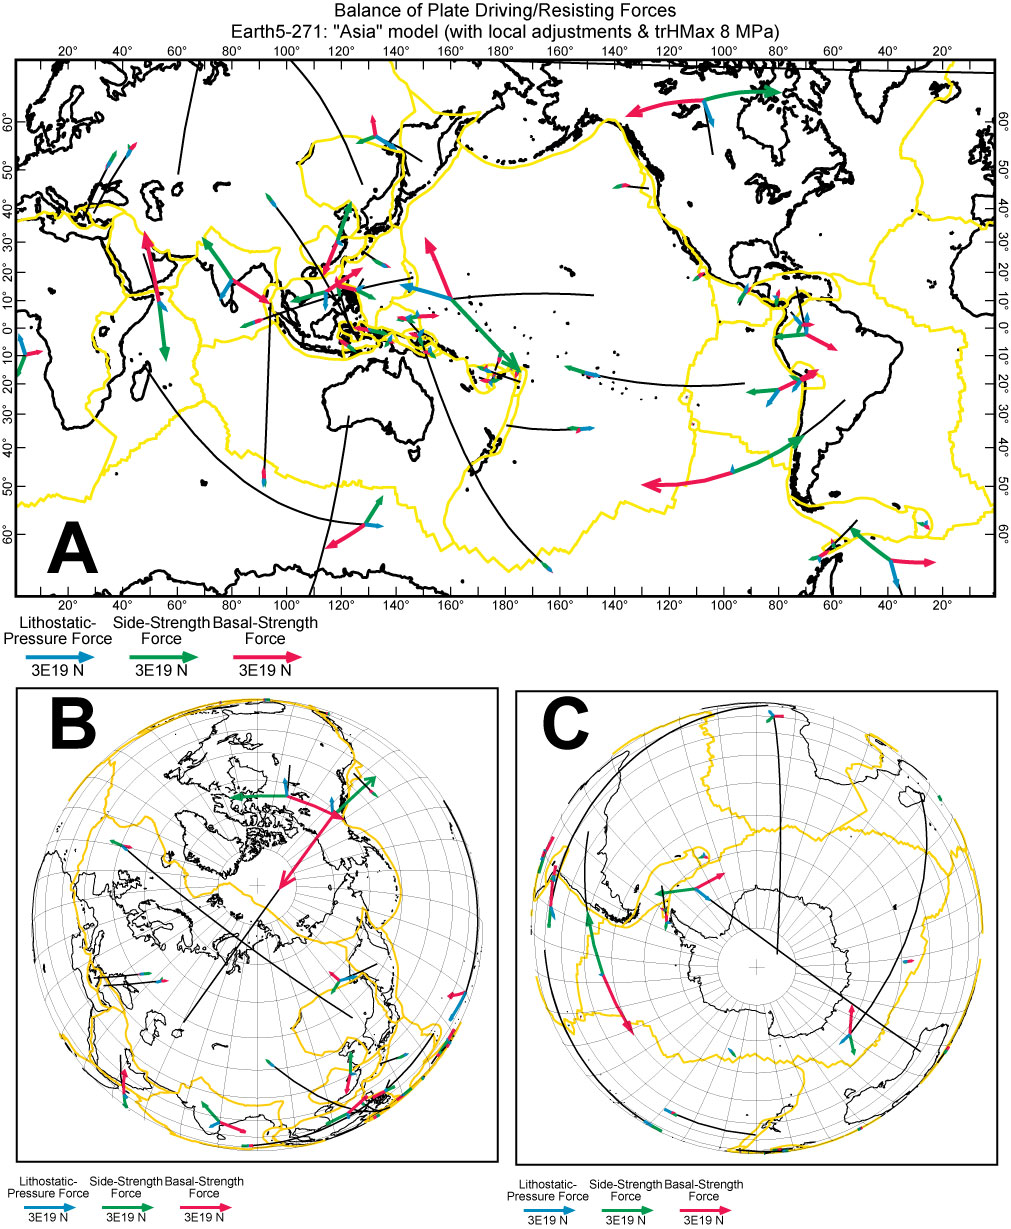
Figure 5. (A) Mercator view of point-force triplets, for each plate, which are statically equivalent to the 3 balanced torque components (lithostatic-pressure, side-strength, and basal-strength) on that plate. Results shown are for preferred model Earth5-271 “Asia”. Details in the torque report file qEarth5-271.out in Bird [2025]; see section “OPEN RESEARCH” at the end of this 2026 paper to access. Each force triplet is connected to the center of its associated plate by a black great-circle arc. Where this great-circle connector is long, any point force not parallel to it indicates torque about a local vertical axis on the plate. Mercator projection. (B) Orthographic North-polar view of same dataset. (C) Orthographic South-polar view of same dataset.