![]()
![]()
![]()
![]()
![]()
Step 37: Plot inferred GPS “noise” velocities?
Assuming that you just ran GPS_Postprocessor2 in the previous Step 36, you should now have a set of 3 new Adobe Illustrator .ai files:
|
g_unfit_residuals-Class1.ai |
Unfit velocities attributed to reference-frame uncertainties (if added, using GPS_Covariance); |
|
g_unfit_residuals-Class2.ai |
Unfit velocities attributed to local noise sources (identified in advance, using GPS_Covariance); |
|
g_unfit_residuals-Class3.ai |
Unfit velocities which are not understood or wanted. |
that represent subdivisions of the {data – model} unfit-residual GPS velocities in your preferred NeoKinema model.
{If you did NOT run GPS_Postprocessor2, please just continue to the next Step.}
This page will show two examples of how such plots can sometimes be useful.
The first example is synthetic (“made-up”), and comes from Bird
& Carafa [2016], where you
can read details and see other maps.
The second is a real case from California, based on some extensions and
re-computation of a UCERF3 model from Field et al. [2013].
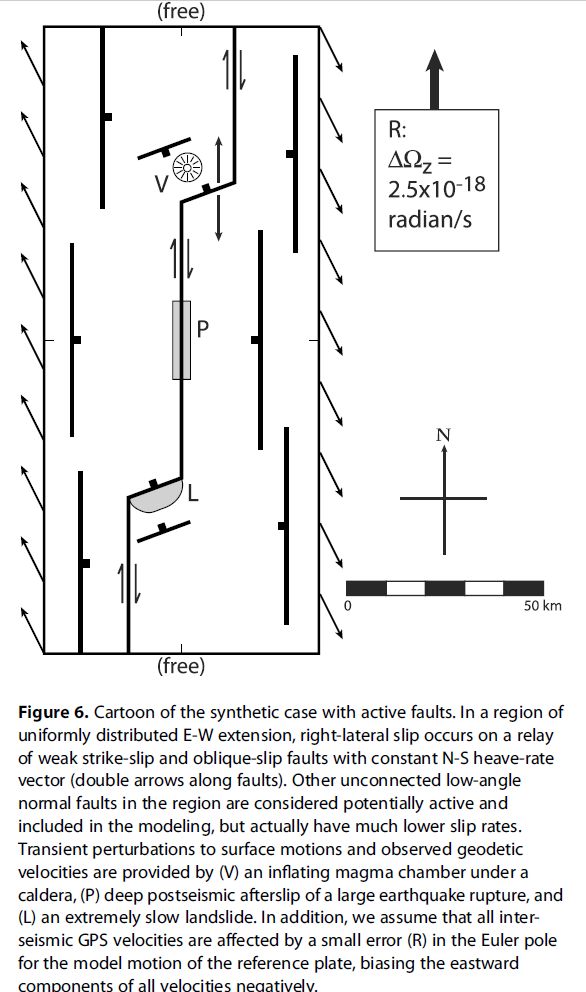
Below is Figure 6 from Bird & Carafa [2016], showing their second synthetic case (with active faults):
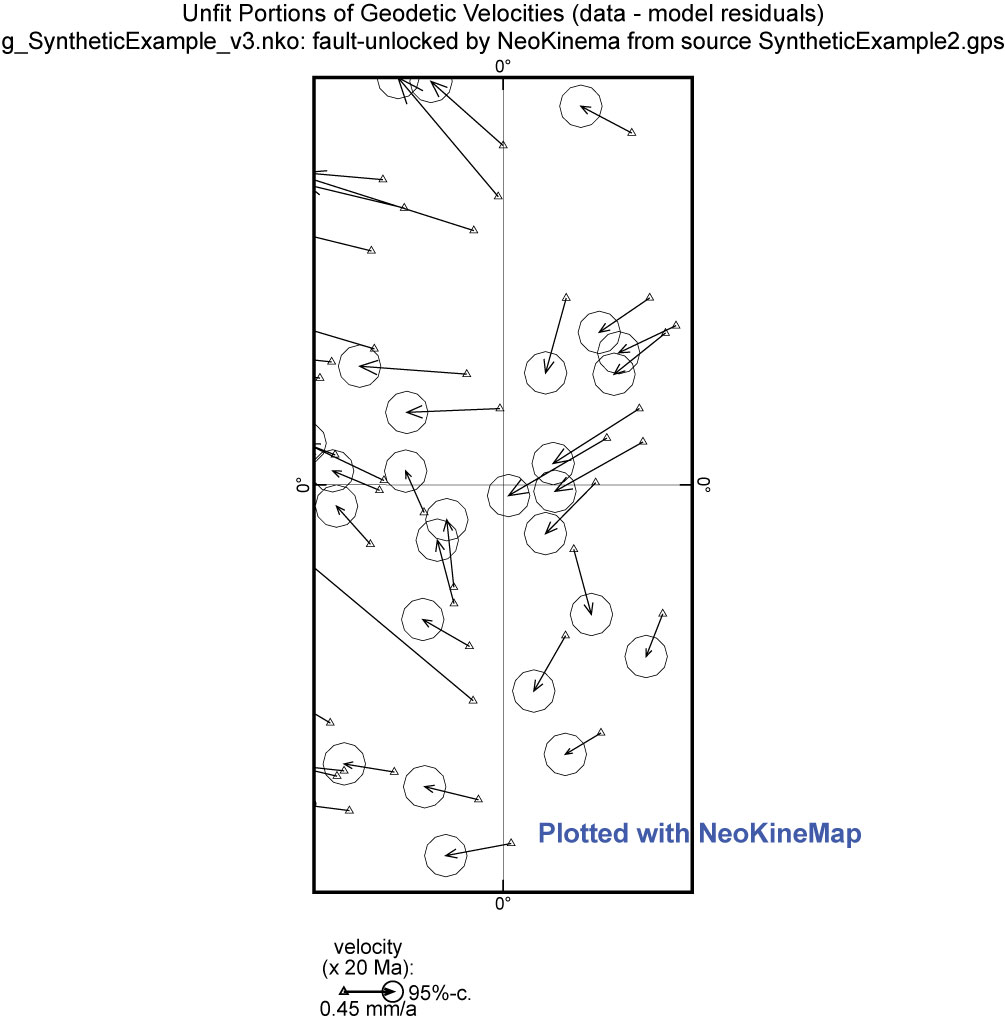
The map below shows unfit-residual GPS velocities as plotted by NeoKineMap;
even though an intelligently-designed GPS covariance matrix (.gp2) was
used in the solution,
and the neotectonics (assumed when creating this synthetic example) were
recovered well,
this plot is not particularly clear, easy to understand, or helpful!
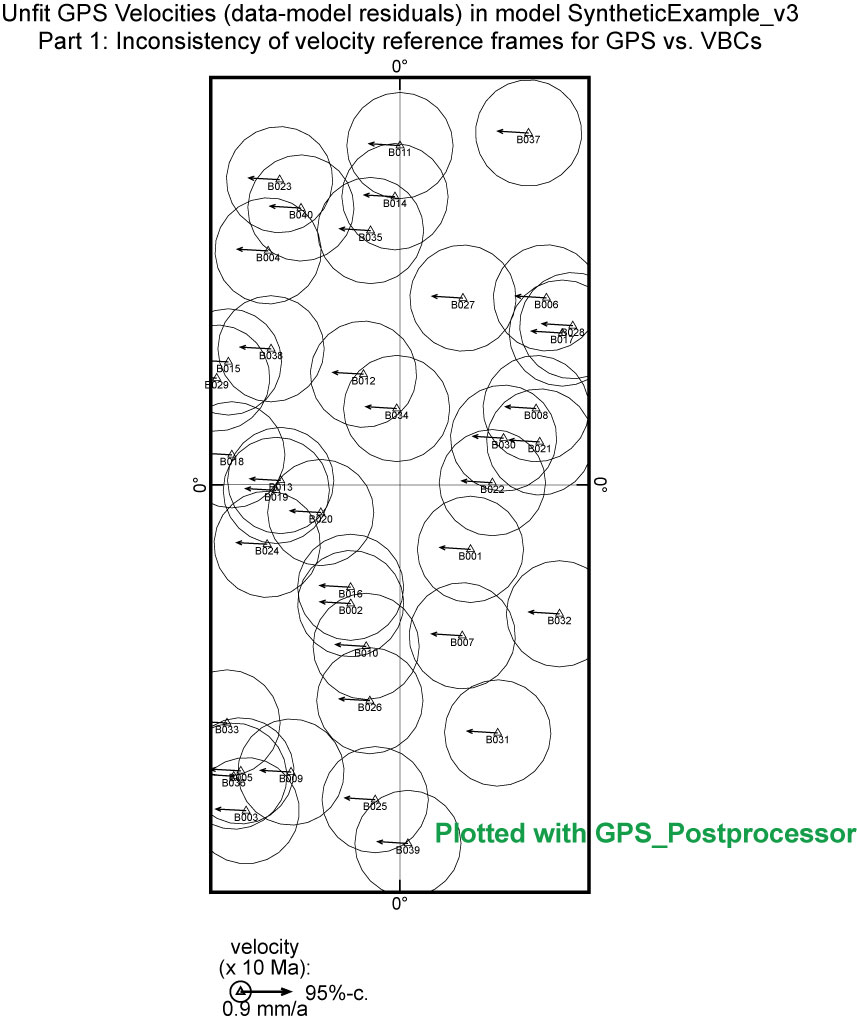
In contrast, the map below is the first of 3 maps produced when GPS_Postprocessor2
is applied to the same NeoKinema model.
It shows clearly how the misfits contain a component (Class 1) of Westward
drift, which was not fit by NeoKinema because
these were attributed to uncertainties in the GPS velocity reference frame
(relative to the velocity boundary conditions, or “VBCs”):
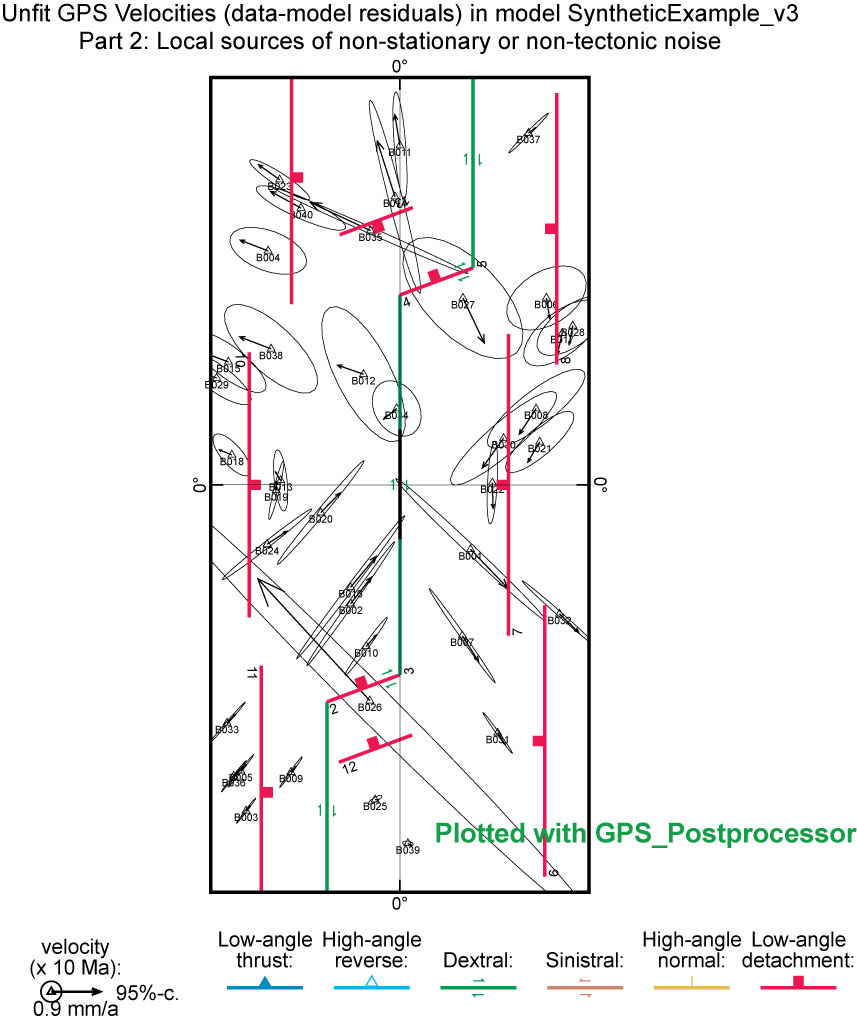
The next map below is the second component (Class 2) of the breakdown of
unfit-residual GPS velocities,
as provided by GPS_Postprocessor2. It shows the actual amplitudes
(and signs) of the velocity components
attributed to local “noise” sources. (In this case, that includes an
active volcano, postseismic relaxation after
a local earthquake, and one very slow landslide; see first map at the top of
this page.)
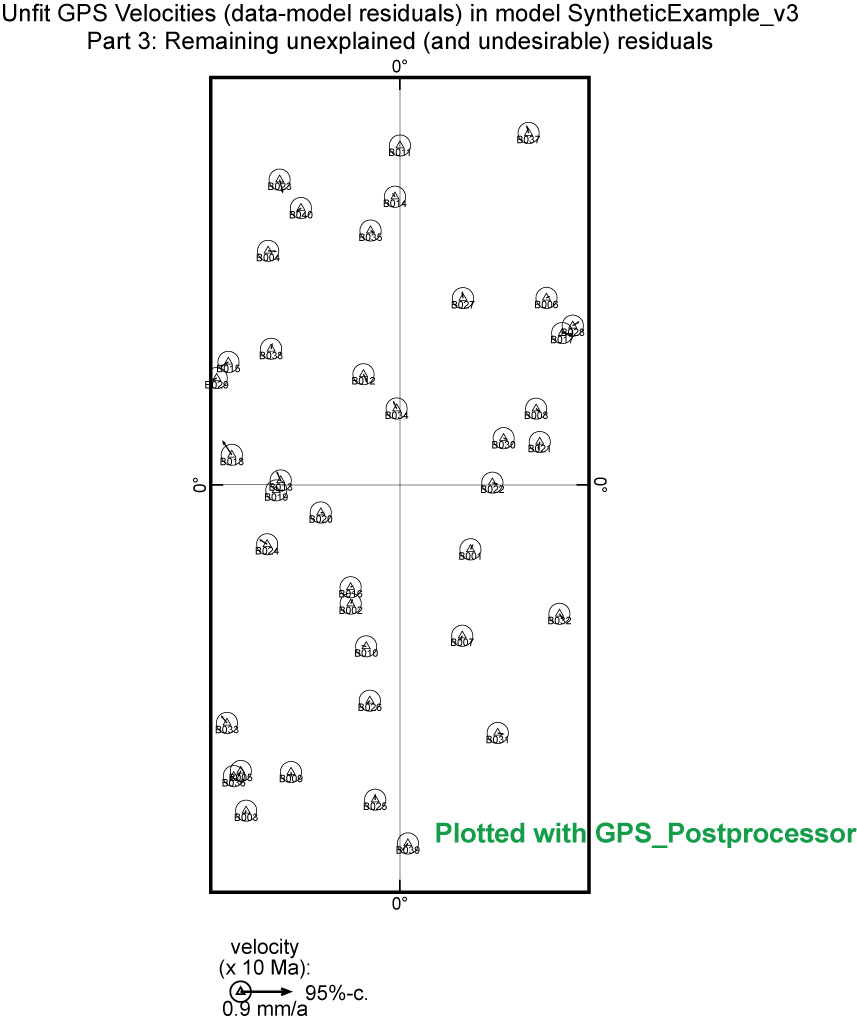
Finally, the map below is the third component (Class 3) of unfit-residual
GPS velocities, which GPS_Postprocessor2
was unable to assign to either reference-frame drift, or known local
noise sources. If there were additional unknown
local noise sources, they might appear in this map. However, because this
is a synthetic example, there are no more
local noise sources, and the map is very quiet!
The second example is real. When the deformation model
NSHM-WUS_2013001 was created for the UCERF3
seismic-hazard-estimation project [Field et al., 2014], no GPS covariance (.gp2)
matrix was used.
However, as an illustration of pre- and post-processing, I used GPS_Covariance
to create a simple model .gp2 matrix
for the same .gps input dataset; the only noise added that I added was 1
mm/a of reference-frame uncertainty, plus
local magma-chamber-inflation signals (of radial symmetry) associated with each
of 3 active volcanic centers:
Yellowstone (WY), Long Valley (CA), and Coso (CA).
Then NeoKinema model NSHM-WUS_2019001 was run, using all the same inputs
as NSHM-WUS_2013001,
except that this new .gp2 matrix was included in the processing.
Afterward, GPS_Postprocessor2 was applied to the output files.
The main discovery was that the Coso volcanic center was deflating
during the GPS data-collection epoch:
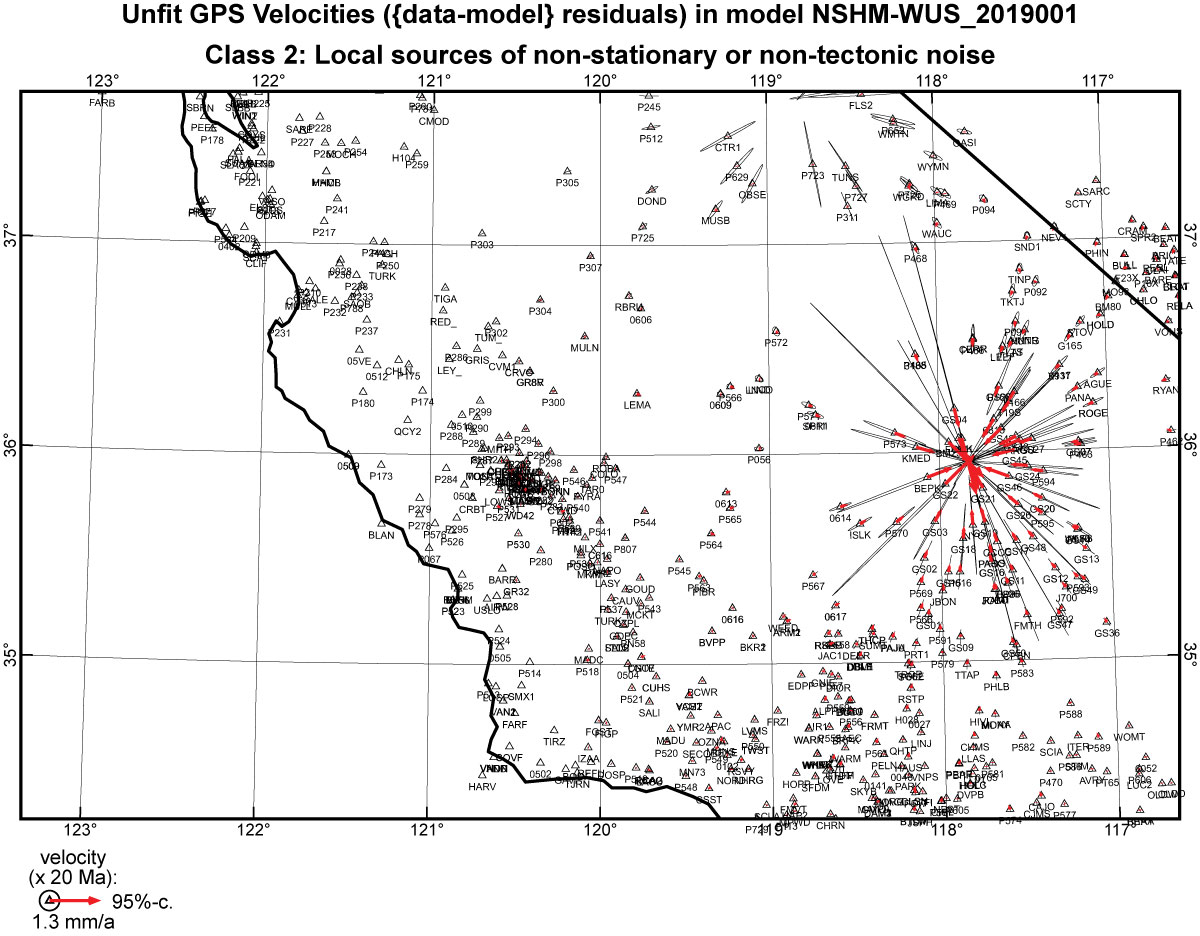
Notice that the fastest horizontal-velocity vectors plotted here are about
1.5 mm/a, and that they all point toward the center
of the Coso volcanic field (right-center, at {117.8°W, 36°N}). Such
deflation could be due to eruptions, or perhaps to
cooling and contraction of magma (especially volatile phases). Note that
the GPS_Covariance & GPS_Postprocessor2
pair of programs performed well, even though the sign of the local noise
was opposite to what was anticipated!
During the same epoch, the Long Valley caldera center {118.8°W, 37.7°N}
and the Yellowstone center {off this map} were quiet.
![]()
![]()
![]()
![]()
![]()