![]()
![]()
![]()
![]()
![]()
Step 14: Plot every aspect of model structure
Before beginning dynamical calculations with Shells, you should check the input data carefully. Plot every aspect of model structure that is contained in (or implied by) the .feg file. Use my graphical programs OrbMapAI and/or FiniteMap in this step:
Introduction to OrbMapAI and FiniteMap
Differences between OrbMapAI and FiniteMap
Available map formats:
high-contrast black/white (for inexpensive publication)
object-based color graphics (for routine inspection of output)
bitmap-based color graphics (for elegant presentations)
What you should plot (and check for errors):
![]() elevation/bathymetry (should look like the .grd
file, except for lower resolution)
elevation/bathymetry (should look like the .grd
file, except for lower resolution)
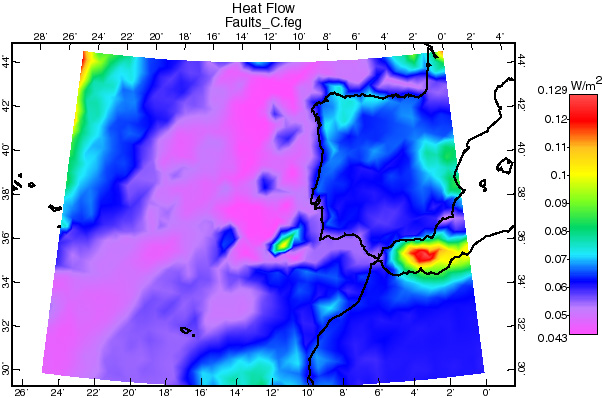
![]() heat-flow (should look like the .grd file)
heat-flow (should look like the .grd file)
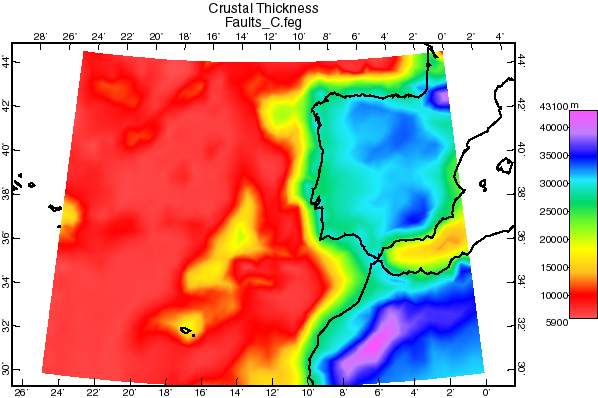
![]() crustal thickness (reasonable range of 5,000 to
75,000 m)
crustal thickness (reasonable range of 5,000 to
75,000 m)
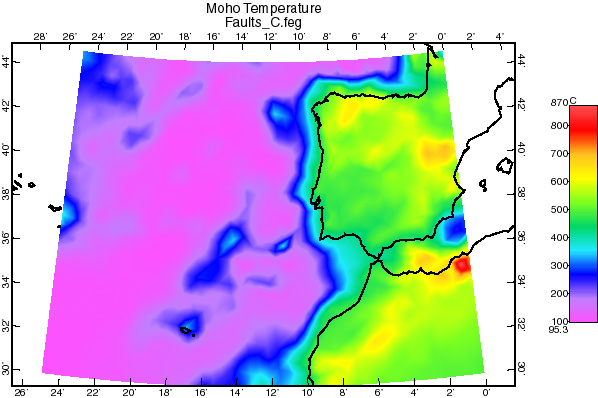
![]() temperature at the Moho (should normally not exceed
melting point)
temperature at the Moho (should normally not exceed
melting point)
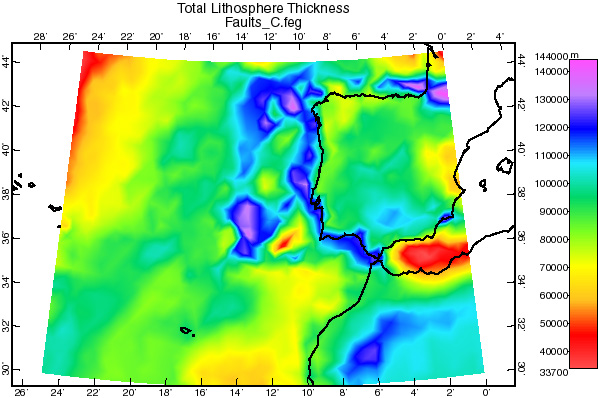
![]() total lithosphere thickness (crust + mantle
lithosphere; should be plausible)
total lithosphere thickness (crust + mantle
lithosphere; should be plausible)
![]() temperature at the base of the lithosphere (should be
uniform)
temperature at the base of the lithosphere (should be
uniform)
![]() pressure anomaly at the base of the lithosphere (should
be small, for isostatic balance)
pressure anomaly at the base of the lithosphere (should
be small, for isostatic balance)
![]()
![]()
![]()
![]()
![]()